29
/
en
AIzaSyAYiBZKx7MnpbEhh9jyipgxe19OcubqV5w
April 1, 2024
255269
Swaziland
SWZ
true
2
1
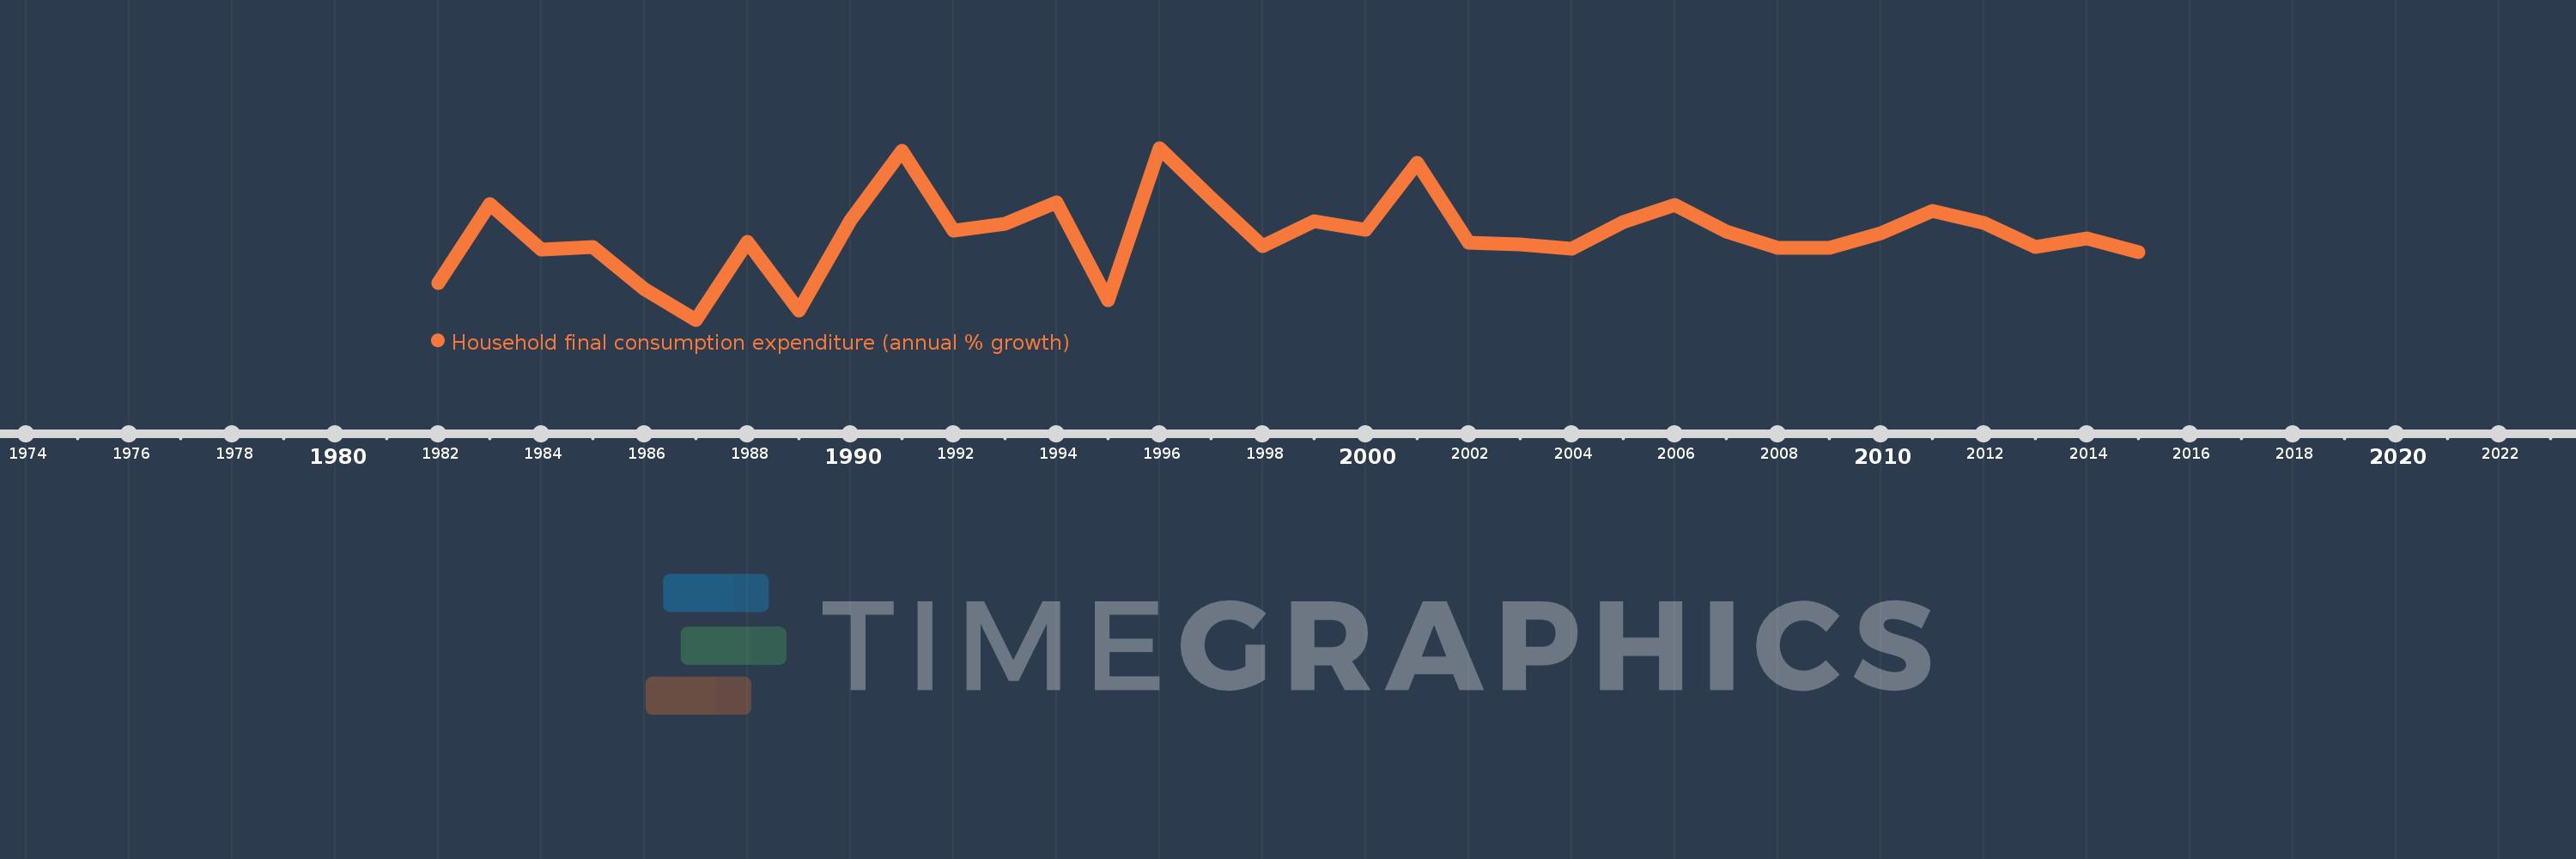
Household final consumption expenditure (annual % growth)
2015,2014,2013,2012,2011,2010,2009,2008,2007,2006,2005,2004,2003,2002,2001,2000,1999,1998,1997,1996,1995,1994,1993,1992,1991,1990,1989,1988,1987,1986,1985,1984,1983,1982
This statistics in other country:
AlbaniaAlgeriaAntigua and BarbudaArab WorldArgentinaArmeniaAustraliaAustriaAzerbaijanBahamas, TheBahrainBangladeshBarbadosBelarusBelgiumBelizeBeninBhutanBoliviaBosnia and HerzegovinaBotswanaBrazilBrunei DarussalamBulgariaBurkina FasoBurundiCabo VerdeCambodiaCameroonCanadaCaribbean small statesCentral Europe and the BalticsChadChileChinaColombiaComorosCongo, Dem. Rep.Congo, Rep.Costa RicaCote d'IvoireCroatiaCubaCyprusCzech RepublicDenmarkDominican RepublicEarly-demographic dividendEast Asia & PacificEast Asia & Pacific (excluding high income)East Asia & Pacific (IDA & IBRD countries)EcuadorEgypt, Arab Rep.El SalvadorEquatorial GuineaEritreaEstoniaEthiopiaEuro areaEurope & Central AsiaEurope & Central Asia (excluding high income)Europe & Central Asia (IDA & IBRD countries)European UnionFinlandFranceGabonGambia, TheGeorgiaGermanyGhanaGreeceGuatemalaGuineaGuinea-BissauHaitiHeavily indebted poor countries (HIPC)High incomeHondurasHong Kong SAR, ChinaHungaryIBRD onlyIcelandIDA & IBRD totalIDA blendIDA onlyIDA totalIndiaIndonesiaIran, Islamic Rep.IrelandIsraelItalyJamaicaJapanJordanKazakhstanKenyaKorea, Rep.KosovoKuwaitKyrgyz RepublicLao PDRLate-demographic dividendLatin America & Caribbean Latin America & Caribbean (excluding high income)Latin America & the Caribbean (IDA & IBRD countries)LatviaLeast developed countries: UN classificationLebanonLiberiaLithuaniaLow & middle incomeLow incomeLower middle incomeLuxembourgMacao SAR, ChinaMacedonia, FYRMadagascarMalawiMalaysiaMaliMaltaMauritaniaMauritiusMexicoMiddle East & North AfricaMiddle East & North Africa (excluding high income)Middle East & North Africa (IDA & IBRD countries)Middle incomeMoldovaMongoliaMontenegroMoroccoMozambiqueNamibiaNepalNetherlandsNew ZealandNicaraguaNigerNigeriaNorth AmericaNorwayOECD membersOmanOther small statesPakistanPanamaPapua New GuineaParaguayPeruPhilippinesPolandPortugalPost-demographic dividendPre-demographic dividendPuerto RicoQatarRomaniaRussian FederationRwandaSaudi ArabiaSenegalSerbiaSeychellesSierra LeoneSingaporeSlovak RepublicSloveniaSmall statesSomaliaSouth AfricaSouth AsiaSouth Asia (IDA & IBRD)South SudanSpainSri LankaSub-Saharan Africa Sub-Saharan Africa (excluding high income)Sub-Saharan Africa (IDA & IBRD countries)SudanSurinameSwazilandSwedenSwitzerlandSyrian Arab RepublicTajikistanTanzaniaThailandTimor-LesteTogoTrinidad and TobagoTunisiaTurkeyTurkmenistanUgandaUkraineUnited Arab EmiratesUnited KingdomUnited StatesUpper middle incomeUruguayVanuatuVenezuela, RBVietnamWest Bank and GazaWorldZimbabwe Timeline:
This timeline shows a graph from 1982 to 2015 of Swaziland. No data until 1981. Number of actual observations by date: 34.
Source name:
World Development Indicators
Source organization:
World Bank national accounts data, and OECD National Accounts data files.
Categories, topics:
Economy & Growth
Last updated:
apr 23, 2017
Indicators value changes by year
Minimum:
-17.401
jan 1, 1987
At the date of observation
Value
Absolute change
Change from previous value
jan 1, 1982
-8.358
-8.358
0.0%
jan 1, 1983
11.423
+19.781
-236.66%
jan 1, 1984
0.0
-11.423
-100.0%
jan 1, 1985
0.738
+0.738
%
jan 1, 1986
-9.712
-10.45
-1.42K%
jan 1, 1987
-17.401
-7.689
79.17%
jan 1, 1988
2.024
+19.425
-111.63%
jan 1, 1989
-15.177
-17.201
-849.89%
jan 1, 1990
7.419
+22.596
-148.89%
jan 1, 1991
24.795
+17.375
234.18%
jan 1, 1992
4.763
-20.031
-80.79%
jan 1, 1993
6.477
+1.713
35.97%
jan 1, 1994
11.819
+5.342
82.48%
jan 1, 1995
-12.461
-24.28
-205.43%
jan 1, 1996
25.42
+37.881
-304.0%
jan 1, 1997
12.96
-12.461
-49.02%
jan 1, 1998
0.947
-12.013
-92.69%
jan 1, 1999
7.083
+6.136
647.85%
jan 1, 2000
5.021
-2.063
-29.12%
jan 1, 2001
21.614
+16.593
330.5%
jan 1, 2002
1.795
-19.819
-91.69%
jan 1, 2003
1.306
-0.49
-27.27%
jan 1, 2004
0.362
-0.943
-72.26%
jan 1, 2005
6.85
+6.488
1.79K%
jan 1, 2006
11.278
+4.428
64.64%
jan 1, 2007
4.581
-6.697
-59.38%
jan 1, 2008
0.61
-3.972
-86.69%
jan 1, 2009
0.423
-0.187
-30.61%
jan 1, 2010
4.076
+3.653
863.45%
jan 1, 2011
9.829
+5.753
141.13%
jan 1, 2012
6.701
-3.128
-31.82%
jan 1, 2013
0.684
-6.017
-89.79%
jan 1, 2014
2.892
+2.208
322.77%
jan 1, 2015
-0.468
-3.36
-116.18%
Ranking of countries by current statistics by years


Comments: