29
/
en
AIzaSyAYiBZKx7MnpbEhh9jyipgxe19OcubqV5w
April 1, 2024
253113
Sudan
SDN
true
2
1
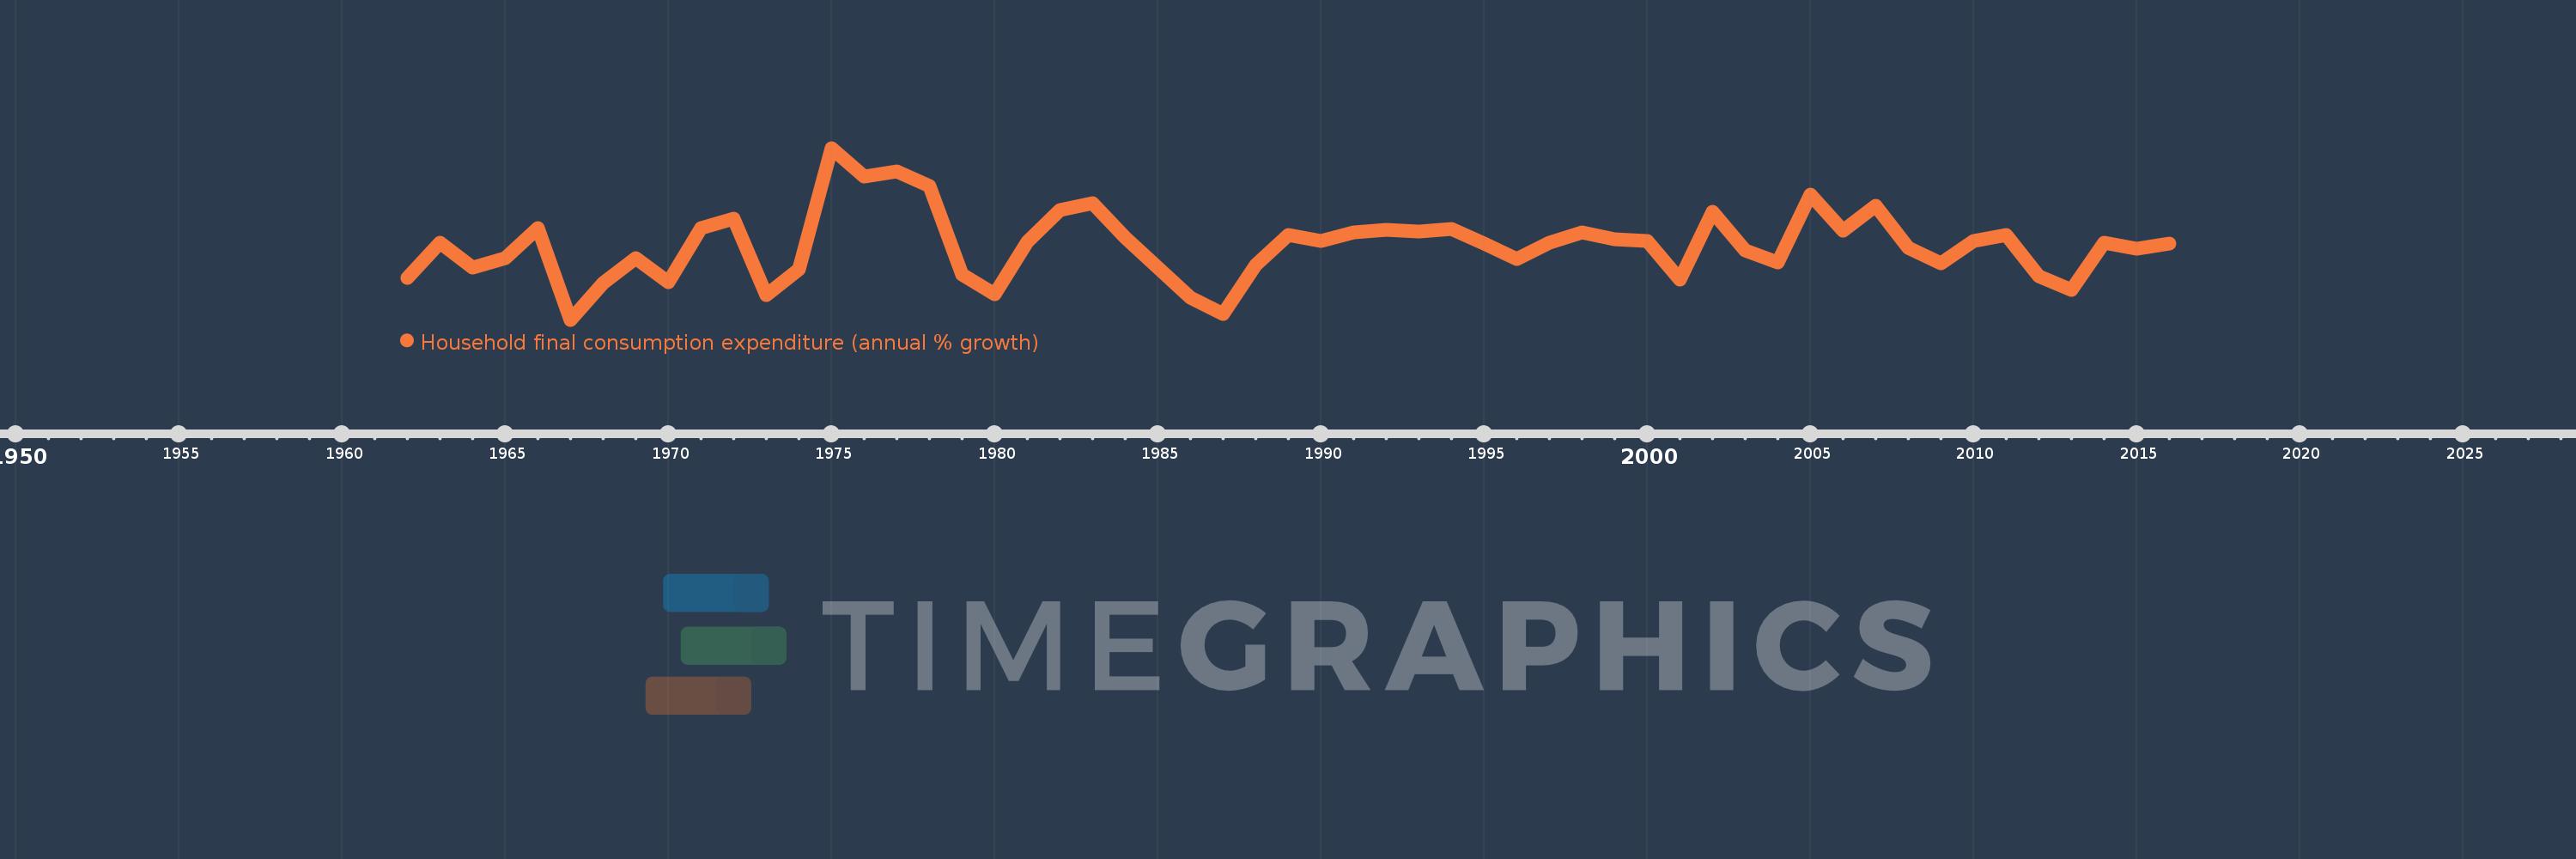
Household final consumption expenditure (annual % growth)
2016,2015,2014,2013,2012,2011,2010,2009,2008,2007,2006,2005,2004,2003,2002,2001,2000,1999,1998,1997,1996,1995,1994,1993,1992,1991,1990,1989,1988,1987,1986,1985,1984,1983,1982,1981,1980,1979,1978,1977,1976,1975,1974,1973,1972,1971,1970,1969,1968,1967,1966,1965,1964,1963,1962
This statistics in other country:
AlbaniaAlgeriaAntigua and BarbudaArab WorldArgentinaArmeniaAustraliaAustriaAzerbaijanBahamas, TheBahrainBangladeshBarbadosBelarusBelgiumBelizeBeninBhutanBoliviaBosnia and HerzegovinaBotswanaBrazilBrunei DarussalamBulgariaBurkina FasoBurundiCabo VerdeCambodiaCameroonCanadaCaribbean small statesCentral Europe and the BalticsChadChileChinaColombiaComorosCongo, Dem. Rep.Congo, Rep.Costa RicaCote d'IvoireCroatiaCubaCyprusCzech RepublicDenmarkDominican RepublicEarly-demographic dividendEast Asia & PacificEast Asia & Pacific (excluding high income)East Asia & Pacific (IDA & IBRD countries)EcuadorEgypt, Arab Rep.El SalvadorEquatorial GuineaEritreaEstoniaEthiopiaEuro areaEurope & Central AsiaEurope & Central Asia (excluding high income)Europe & Central Asia (IDA & IBRD countries)European UnionFinlandFranceGabonGambia, TheGeorgiaGermanyGhanaGreeceGuatemalaGuineaGuinea-BissauHaitiHeavily indebted poor countries (HIPC)High incomeHondurasHong Kong SAR, ChinaHungaryIBRD onlyIcelandIDA & IBRD totalIDA blendIDA onlyIDA totalIndiaIndonesiaIran, Islamic Rep.IrelandIsraelItalyJamaicaJapanJordanKazakhstanKenyaKorea, Rep.KosovoKuwaitKyrgyz RepublicLao PDRLate-demographic dividendLatin America & Caribbean Latin America & Caribbean (excluding high income)Latin America & the Caribbean (IDA & IBRD countries)LatviaLeast developed countries: UN classificationLebanonLiberiaLithuaniaLow & middle incomeLow incomeLower middle incomeLuxembourgMacao SAR, ChinaMacedonia, FYRMadagascarMalawiMalaysiaMaliMaltaMauritaniaMauritiusMexicoMiddle East & North AfricaMiddle East & North Africa (excluding high income)Middle East & North Africa (IDA & IBRD countries)Middle incomeMoldovaMongoliaMontenegroMoroccoMozambiqueNamibiaNepalNetherlandsNew ZealandNicaraguaNigerNigeriaNorth AmericaNorwayOECD membersOmanOther small statesPakistanPanamaPapua New GuineaParaguayPeruPhilippinesPolandPortugalPost-demographic dividendPre-demographic dividendPuerto RicoQatarRomaniaRussian FederationRwandaSaudi ArabiaSenegalSerbiaSeychellesSierra LeoneSingaporeSlovak RepublicSloveniaSmall statesSomaliaSouth AfricaSouth AsiaSouth Asia (IDA & IBRD)South SudanSpainSri LankaSub-Saharan Africa Sub-Saharan Africa (excluding high income)Sub-Saharan Africa (IDA & IBRD countries)SudanSurinameSwazilandSwedenSwitzerlandSyrian Arab RepublicTajikistanTanzaniaThailandTimor-LesteTogoTrinidad and TobagoTunisiaTurkeyTurkmenistanUgandaUkraineUnited Arab EmiratesUnited KingdomUnited StatesUpper middle incomeUruguayVanuatuVenezuela, RBVietnamWest Bank and GazaWorldZimbabwe Timeline:
This timeline shows a graph from 1962 to 2016 of Sudan. No data until 1961. Number of actual observations by date: 55.
Source name:
World Development Indicators
Source organization:
World Bank national accounts data, and OECD National Accounts data files.
Categories, topics:
Economy & Growth
Last updated:
apr 23, 2017
Indicators value changes by year
Minimum:
-12.239
jan 1, 1967
At the date of observation
Value
Absolute change
Change from previous value
jan 1, 1962
-3.72
-3.72
0.0%
jan 1, 1963
3.525
+7.245
-194.77%
jan 1, 1964
-1.553
-5.078
-144.05%
jan 1, 1965
0.415
+1.968
-126.73%
jan 1, 1966
6.669
+6.253
1.51K%
jan 1, 1967
-12.239
-18.908
-283.54%
jan 1, 1968
-4.711
+7.529
-61.51%
jan 1, 1969
0.353
+5.064
-107.5%
jan 1, 1970
-4.58
-4.933
-1.4K%
jan 1, 1971
6.675
+11.255
-245.76%
jan 1, 1972
8.612
+1.936
29.01%
jan 1, 1973
-7.253
-15.865
-184.22%
jan 1, 1974
-1.83
+5.423
-74.77%
jan 1, 1975
23.1
+24.93
-1.36K%
jan 1, 1976
17.149
-5.951
-25.76%
jan 1, 1977
18.197
+1.048
6.11%
jan 1, 1978
15.35
-2.846
-15.64%
jan 1, 1979
-2.887
-18.238
-118.81%
jan 1, 1980
-6.921
-4.034
139.69%
jan 1, 1981
3.728
+10.649
-153.86%
jan 1, 1982
10.297
+6.569
176.21%
jan 1, 1983
11.775
+1.479
14.36%
jan 1, 1984
4.64
-7.136
-60.6%
jan 1, 1985
-1.499
-6.139
-132.32%
jan 1, 1986
-7.726
-6.227
415.28%
jan 1, 1987
-11.004
-3.278
42.42%
jan 1, 1988
-0.94
+10.064
-91.46%
jan 1, 1989
5.256
+6.196
-659.13%
jan 1, 1990
3.947
-1.308
-24.9%
jan 1, 1991
5.768
+1.821
46.12%
jan 1, 1992
6.32
+0.552
9.57%
jan 1, 1993
5.926
-0.394
-6.23%
jan 1, 1994
6.492
+0.566
9.55%
jan 1, 1995
3.396
-3.096
-47.7%
jan 1, 1996
0.303
-3.093
-91.08%
jan 1, 1997
3.538
+3.235
1.07K%
jan 1, 1998
5.678
+2.14
60.49%
jan 1, 1999
4.35
-1.328
-23.39%
jan 1, 2000
3.924
-0.425
-9.78%
jan 1, 2001
-3.979
-7.904
-201.4%
jan 1, 2002
9.947
+13.926
-349.97%
jan 1, 2003
1.986
-7.961
-80.04%
jan 1, 2004
-0.512
-2.498
-125.8%
jan 1, 2005
13.565
+14.078
-2.75K%
jan 1, 2006
6.116
-7.449
-54.91%
jan 1, 2007
11.189
+5.073
82.94%
jan 1, 2008
2.612
-8.577
-76.65%
jan 1, 2009
-0.617
-3.23
-123.63%
jan 1, 2010
3.997
+4.614
-747.5%
jan 1, 2011
5.28
+1.284
32.11%
jan 1, 2012
-3.232
-8.512
-161.2%
jan 1, 2013
-6.105
-2.873
88.91%
jan 1, 2014
3.691
+9.796
-160.46%
jan 1, 2015
2.348
-1.343
-36.39%
jan 1, 2016
3.5
+1.152
49.06%
Ranking of countries by current statistics by years


Comments: