29
/
en
AIzaSyAYiBZKx7MnpbEhh9jyipgxe19OcubqV5w
April 1, 2024
167588
Kenya
KEN
true
2
1
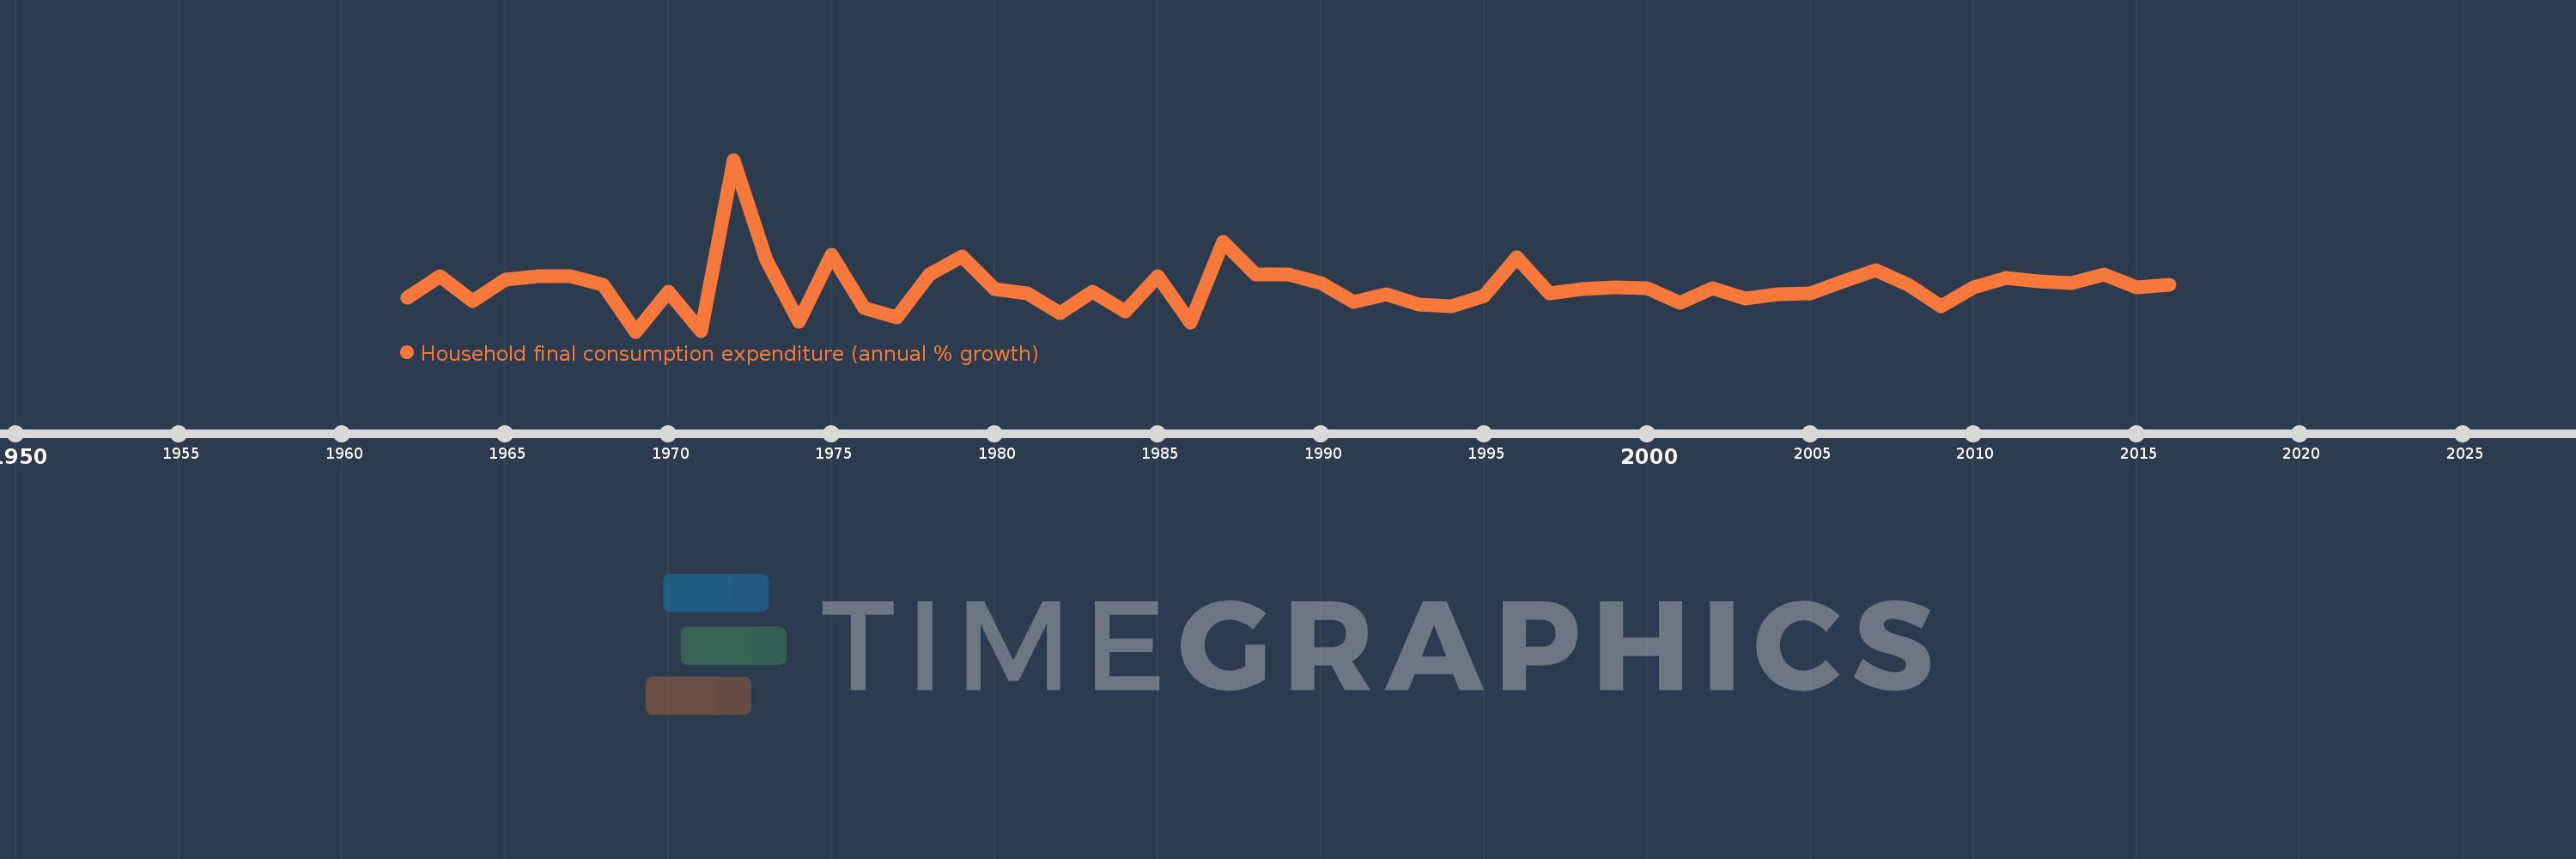
Household final consumption expenditure (annual % growth)
2016,2015,2014,2013,2012,2011,2010,2009,2008,2007,2006,2005,2004,2003,2002,2001,2000,1999,1998,1997,1996,1995,1994,1993,1992,1991,1990,1989,1988,1987,1986,1985,1984,1983,1982,1981,1980,1979,1978,1977,1976,1975,1974,1973,1972,1971,1970,1969,1968,1967,1966,1965,1964,1963,1962
This statistics in other country:
AlbaniaAlgeriaAntigua and BarbudaArab WorldArgentinaArmeniaAustraliaAustriaAzerbaijanBahamas, TheBahrainBangladeshBarbadosBelarusBelgiumBelizeBeninBhutanBoliviaBosnia and HerzegovinaBotswanaBrazilBrunei DarussalamBulgariaBurkina FasoBurundiCabo VerdeCambodiaCameroonCanadaCaribbean small statesCentral Europe and the BalticsChadChileChinaColombiaComorosCongo, Dem. Rep.Congo, Rep.Costa RicaCote d'IvoireCroatiaCubaCyprusCzech RepublicDenmarkDominican RepublicEarly-demographic dividendEast Asia & PacificEast Asia & Pacific (excluding high income)East Asia & Pacific (IDA & IBRD countries)EcuadorEgypt, Arab Rep.El SalvadorEquatorial GuineaEritreaEstoniaEthiopiaEuro areaEurope & Central AsiaEurope & Central Asia (excluding high income)Europe & Central Asia (IDA & IBRD countries)European UnionFinlandFranceGabonGambia, TheGeorgiaGermanyGhanaGreeceGuatemalaGuineaGuinea-BissauHaitiHeavily indebted poor countries (HIPC)High incomeHondurasHong Kong SAR, ChinaHungaryIBRD onlyIcelandIDA & IBRD totalIDA blendIDA onlyIDA totalIndiaIndonesiaIran, Islamic Rep.IrelandIsraelItalyJamaicaJapanJordanKazakhstanKenyaKorea, Rep.KosovoKuwaitKyrgyz RepublicLao PDRLate-demographic dividendLatin America & Caribbean Latin America & Caribbean (excluding high income)Latin America & the Caribbean (IDA & IBRD countries)LatviaLeast developed countries: UN classificationLebanonLiberiaLithuaniaLow & middle incomeLow incomeLower middle incomeLuxembourgMacao SAR, ChinaMacedonia, FYRMadagascarMalawiMalaysiaMaliMaltaMauritaniaMauritiusMexicoMiddle East & North AfricaMiddle East & North Africa (excluding high income)Middle East & North Africa (IDA & IBRD countries)Middle incomeMoldovaMongoliaMontenegroMoroccoMozambiqueNamibiaNepalNetherlandsNew ZealandNicaraguaNigerNigeriaNorth AmericaNorwayOECD membersOmanOther small statesPakistanPanamaPapua New GuineaParaguayPeruPhilippinesPolandPortugalPost-demographic dividendPre-demographic dividendPuerto RicoQatarRomaniaRussian FederationRwandaSaudi ArabiaSenegalSerbiaSeychellesSierra LeoneSingaporeSlovak RepublicSloveniaSmall statesSomaliaSouth AfricaSouth AsiaSouth Asia (IDA & IBRD)South SudanSpainSri LankaSub-Saharan Africa Sub-Saharan Africa (excluding high income)Sub-Saharan Africa (IDA & IBRD countries)SudanSurinameSwazilandSwedenSwitzerlandSyrian Arab RepublicTajikistanTanzaniaThailandTimor-LesteTogoTrinidad and TobagoTunisiaTurkeyTurkmenistanUgandaUkraineUnited Arab EmiratesUnited KingdomUnited StatesUpper middle incomeUruguayVanuatuVenezuela, RBVietnamWest Bank and GazaWorldZimbabwe Timeline:
This timeline shows a graph from 1962 to 2016 of Kenya. No data until 1961. Number of actual observations by date: 55.
Source name:
World Development Indicators
Source organization:
World Bank national accounts data, and OECD National Accounts data files.
Categories, topics:
Economy & Growth
Last updated:
apr 23, 2017
Indicators value changes by year
Minimum:
-9.579
jan 1, 1969
Maximum:
44.943
jan 1, 1972
At the date of observation
Value
Absolute change
Change from previous value
jan 1, 1962
1.246
+1.246
0.0%
jan 1, 1963
7.991
+6.745
541.14%
jan 1, 1964
0.124
-7.867
-98.45%
jan 1, 1965
6.911
+6.787
5.48K%
jan 1, 1966
7.928
+1.017
14.72%
jan 1, 1967
7.912
-0.016
-0.2%
jan 1, 1968
5.325
-2.587
-32.7%
jan 1, 1969
-9.579
-14.904
-279.89%
jan 1, 1970
3.018
+12.597
-131.5%
jan 1, 1971
-9.524
-12.542
-415.59%
jan 1, 1972
44.943
+54.467
-571.88%
jan 1, 1973
13.139
-31.804
-70.76%
jan 1, 1974
-6.568
-19.707
-149.99%
jan 1, 1975
14.955
+21.523
-327.7%
jan 1, 1976
-1.959
-16.914
-113.1%
jan 1, 1977
-5.158
-3.199
163.29%
jan 1, 1978
8.503
+13.661
-264.85%
jan 1, 1979
14.404
+5.901
69.41%
jan 1, 1980
4.01
-10.394
-72.16%
jan 1, 1981
2.491
-1.519
-37.87%
jan 1, 1982
-3.742
-6.233
-250.19%
jan 1, 1983
3.159
+6.901
-184.42%
jan 1, 1984
-3.257
-6.416
-203.12%
jan 1, 1985
7.932
+11.189
-343.5%
jan 1, 1986
-6.821
-14.752
-185.99%
jan 1, 1987
19.014
+25.834
-378.77%
jan 1, 1988
8.674
-10.34
-54.38%
jan 1, 1989
8.491
-0.183
-2.11%
jan 1, 1990
5.936
-2.555
-30.09%
jan 1, 1991
-0.29
-6.226
-104.89%
jan 1, 1992
2.403
+2.693
-927.8%
jan 1, 1993
-1.02
-3.423
-142.46%
jan 1, 1994
-1.544
-0.524
51.32%
jan 1, 1995
1.822
+3.366
-218.04%
jan 1, 1996
14.001
+12.178
668.25%
jan 1, 1997
2.599
-11.402
-81.44%
jan 1, 1998
3.821
+1.222
47.03%
jan 1, 1999
4.578
+0.757
19.8%
jan 1, 2000
4.099
-0.479
-10.46%
jan 1, 2001
-0.383
-4.482
-109.34%
jan 1, 2002
4.148
+4.531
-1.18K%
jan 1, 2003
0.843
-3.304
-79.67%
jan 1, 2004
2.203
+1.359
161.19%
jan 1, 2005
2.42
+0.217
9.86%
jan 1, 2006
6.466
+4.046
167.21%
jan 1, 2007
9.925
+3.458
53.48%
jan 1, 2008
5.296
-4.629
-46.64%
jan 1, 2009
-1.519
-6.815
-128.68%
jan 1, 2010
4.589
+6.108
-402.11%
jan 1, 2011
7.489
+2.9
63.19%
jan 1, 2012
6.278
-1.21
-16.16%
jan 1, 2013
5.697
-0.581
-9.25%
jan 1, 2014
8.451
+2.754
48.33%
jan 1, 2015
4.583
-3.869
-45.78%
jan 1, 2016
5.261
+0.678
14.8%
Ranking of countries by current statistics by years


Comments: