29
/
en
AIzaSyAYiBZKx7MnpbEhh9jyipgxe19OcubqV5w
April 1, 2024
112342
Costa Rica
CRI
true
2
1
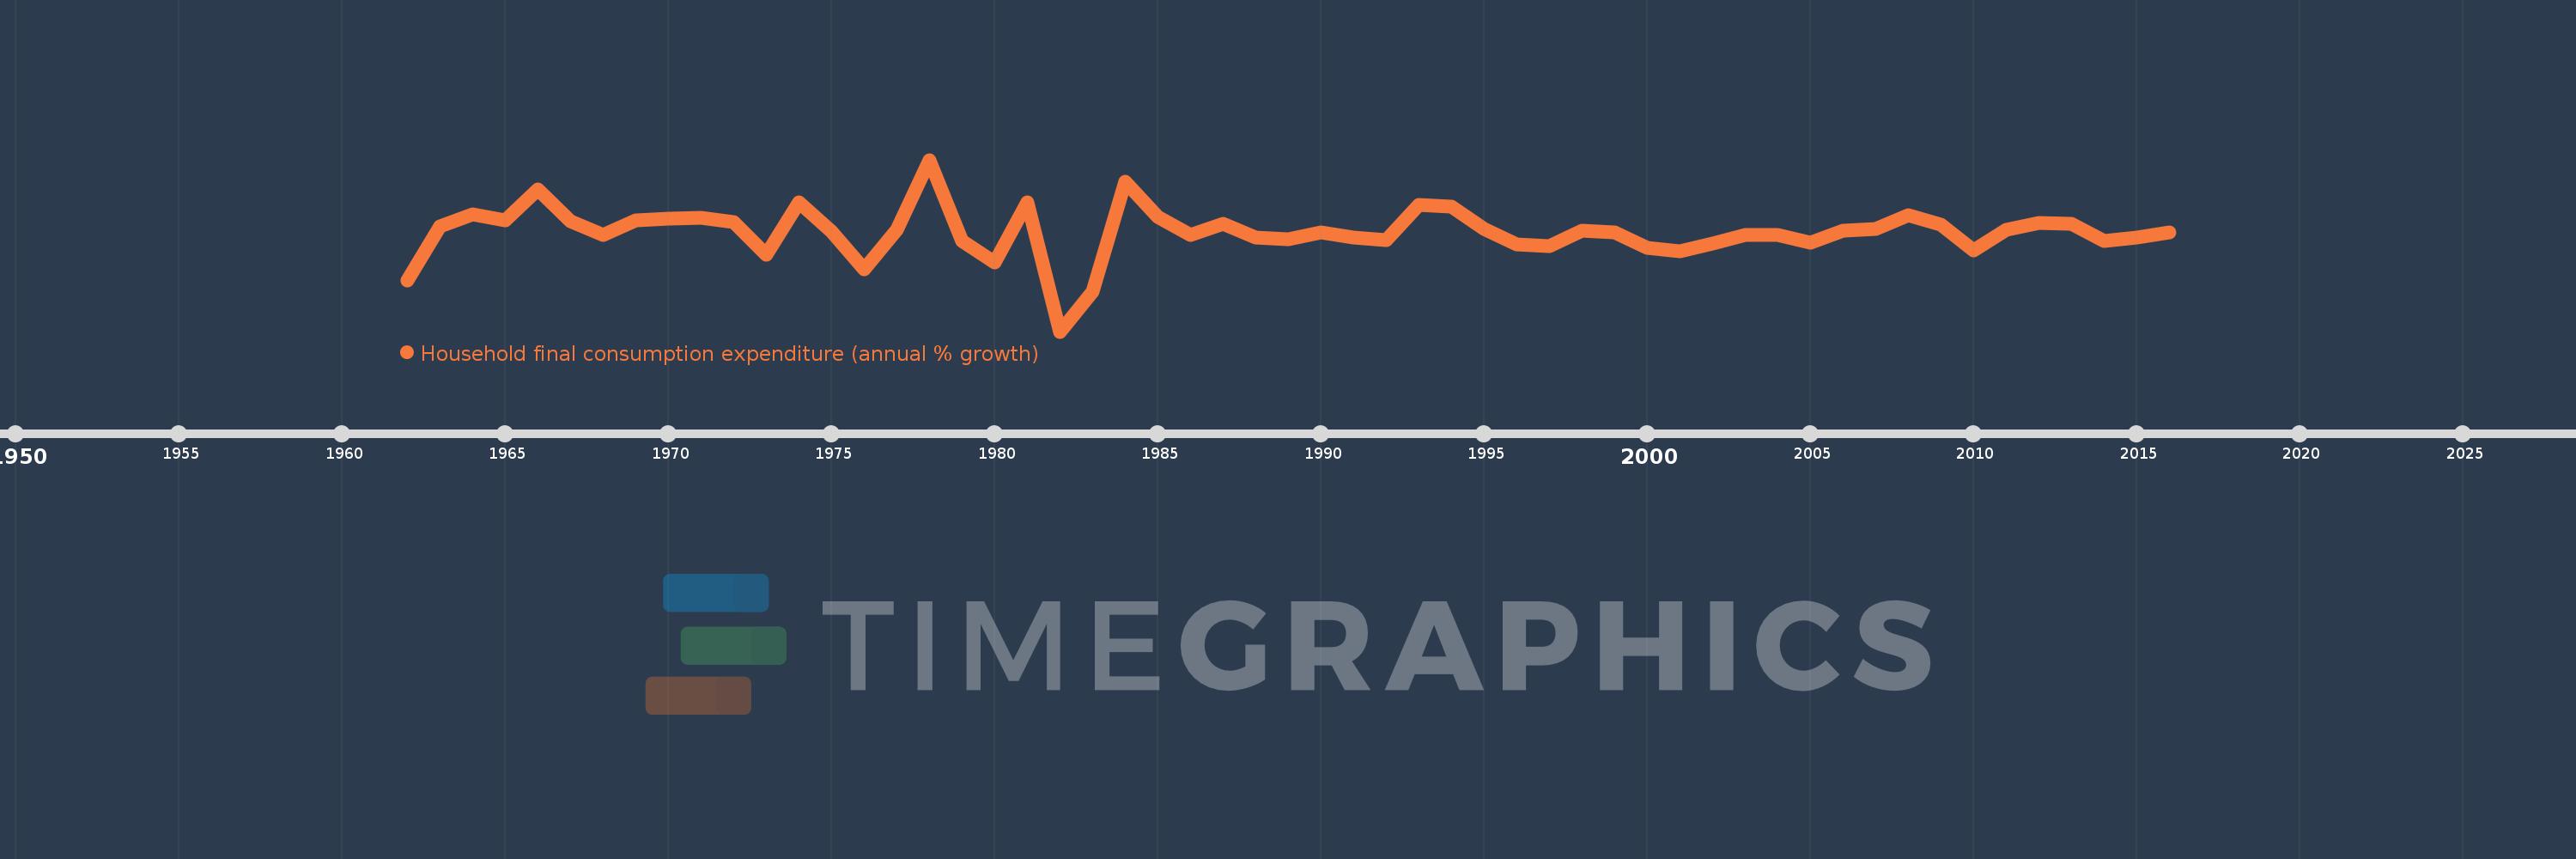
Household final consumption expenditure (annual % growth)
2016,2015,2014,2013,2012,2011,2010,2009,2008,2007,2006,2005,2004,2003,2002,2001,2000,1999,1998,1997,1996,1995,1994,1993,1992,1991,1990,1989,1988,1987,1986,1985,1984,1983,1982,1981,1980,1979,1978,1977,1976,1975,1974,1973,1972,1971,1970,1969,1968,1967,1966,1965,1964,1963,1962
This statistics in other country:
AlbaniaAlgeriaAntigua and BarbudaArab WorldArgentinaArmeniaAustraliaAustriaAzerbaijanBahamas, TheBahrainBangladeshBarbadosBelarusBelgiumBelizeBeninBhutanBoliviaBosnia and HerzegovinaBotswanaBrazilBrunei DarussalamBulgariaBurkina FasoBurundiCabo VerdeCambodiaCameroonCanadaCaribbean small statesCentral Europe and the BalticsChadChileChinaColombiaComorosCongo, Dem. Rep.Congo, Rep.Costa RicaCote d'IvoireCroatiaCubaCyprusCzech RepublicDenmarkDominican RepublicEarly-demographic dividendEast Asia & PacificEast Asia & Pacific (excluding high income)East Asia & Pacific (IDA & IBRD countries)EcuadorEgypt, Arab Rep.El SalvadorEquatorial GuineaEritreaEstoniaEthiopiaEuro areaEurope & Central AsiaEurope & Central Asia (excluding high income)Europe & Central Asia (IDA & IBRD countries)European UnionFinlandFranceGabonGambia, TheGeorgiaGermanyGhanaGreeceGuatemalaGuineaGuinea-BissauHaitiHeavily indebted poor countries (HIPC)High incomeHondurasHong Kong SAR, ChinaHungaryIBRD onlyIcelandIDA & IBRD totalIDA blendIDA onlyIDA totalIndiaIndonesiaIran, Islamic Rep.IrelandIsraelItalyJamaicaJapanJordanKazakhstanKenyaKorea, Rep.KosovoKuwaitKyrgyz RepublicLao PDRLate-demographic dividendLatin America & Caribbean Latin America & Caribbean (excluding high income)Latin America & the Caribbean (IDA & IBRD countries)LatviaLeast developed countries: UN classificationLebanonLiberiaLithuaniaLow & middle incomeLow incomeLower middle incomeLuxembourgMacao SAR, ChinaMacedonia, FYRMadagascarMalawiMalaysiaMaliMaltaMauritaniaMauritiusMexicoMiddle East & North AfricaMiddle East & North Africa (excluding high income)Middle East & North Africa (IDA & IBRD countries)Middle incomeMoldovaMongoliaMontenegroMoroccoMozambiqueNamibiaNepalNetherlandsNew ZealandNicaraguaNigerNigeriaNorth AmericaNorwayOECD membersOmanOther small statesPakistanPanamaPapua New GuineaParaguayPeruPhilippinesPolandPortugalPost-demographic dividendPre-demographic dividendPuerto RicoQatarRomaniaRussian FederationRwandaSaudi ArabiaSenegalSerbiaSeychellesSierra LeoneSingaporeSlovak RepublicSloveniaSmall statesSomaliaSouth AfricaSouth AsiaSouth Asia (IDA & IBRD)South SudanSpainSri LankaSub-Saharan Africa Sub-Saharan Africa (excluding high income)Sub-Saharan Africa (IDA & IBRD countries)SudanSurinameSwazilandSwedenSwitzerlandSyrian Arab RepublicTajikistanTanzaniaThailandTimor-LesteTogoTrinidad and TobagoTunisiaTurkeyTurkmenistanUgandaUkraineUnited Arab EmiratesUnited KingdomUnited StatesUpper middle incomeUruguayVanuatuVenezuela, RBVietnamWest Bank and GazaWorldZimbabwe Timeline:
This timeline shows a graph from 1962 to 2016 of Costa Rica. No data until 1961. Number of actual observations by date: 55.
Source name:
World Development Indicators
Source organization:
World Bank national accounts data, and OECD National Accounts data files.
Categories, topics:
Economy & Growth
Last updated:
apr 23, 2017
Indicators value changes by year
Minimum:
-14.379
jan 1, 1982
Maximum:
18.214
jan 1, 1978
At the date of observation
Value
Absolute change
Change from previous value
jan 1, 1962
-4.648
-4.648
0.0%
jan 1, 1963
5.605
+10.253
-220.59%
jan 1, 1964
7.799
+2.194
39.14%
jan 1, 1965
6.674
-1.125
-14.42%
jan 1, 1966
12.611
+5.937
88.95%
jan 1, 1967
6.57
-6.041
-47.9%
jan 1, 1968
3.947
-2.624
-39.93%
jan 1, 1969
6.657
+2.71
68.67%
jan 1, 1970
7.076
+0.419
6.3%
jan 1, 1971
7.221
+0.145
2.05%
jan 1, 1972
6.391
-0.83
-11.49%
jan 1, 1973
0.18
-6.211
-97.18%
jan 1, 1974
10.116
+9.936
5.52K%
jan 1, 1975
4.579
-5.537
-54.74%
jan 1, 1976
-2.488
-7.067
-154.34%
jan 1, 1977
4.97
+7.458
-299.73%
jan 1, 1978
18.214
+13.244
266.51%
jan 1, 1979
2.819
-15.395
-84.52%
jan 1, 1980
-1.194
-4.013
-142.34%
jan 1, 1981
10.198
+11.391
-954.35%
jan 1, 1982
-14.379
-24.576
-241.0%
jan 1, 1983
-6.753
+7.625
-53.03%
jan 1, 1984
14.076
+20.829
-308.44%
jan 1, 1985
7.392
-6.684
-47.48%
jan 1, 1986
3.94
-3.453
-46.71%
jan 1, 1987
6.068
+2.129
54.04%
jan 1, 1988
3.457
-2.611
-43.03%
jan 1, 1989
3.145
-0.312
-9.03%
jan 1, 1990
4.498
+1.353
43.02%
jan 1, 1991
3.499
-0.999
-22.22%
jan 1, 1992
2.915
-0.584
-16.69%
jan 1, 1993
9.586
+6.671
228.85%
jan 1, 1994
9.412
-0.174
-1.81%
jan 1, 1995
5.096
-4.316
-45.86%
jan 1, 1996
2.137
-2.959
-58.07%
jan 1, 1997
1.823
-0.314
-14.69%
jan 1, 1998
4.817
+2.994
164.28%
jan 1, 1999
4.52
-0.297
-6.16%
jan 1, 2000
1.431
-3.089
-68.34%
jan 1, 2001
0.931
-0.5
-34.96%
jan 1, 2002
2.396
+1.465
157.46%
jan 1, 2003
4.011
+1.615
67.41%
jan 1, 2004
3.963
-0.048
-1.2%
jan 1, 2005
2.548
-1.415
-35.7%
jan 1, 2006
4.8
+2.252
88.37%
jan 1, 2007
5.095
+0.295
6.14%
jan 1, 2008
7.633
+2.538
49.82%
jan 1, 2009
5.832
-1.801
-23.59%
jan 1, 2010
0.946
-4.886
-83.78%
jan 1, 2011
4.892
+3.946
417.18%
jan 1, 2012
6.231
+1.339
27.37%
jan 1, 2013
6.141
-0.09
-1.45%
jan 1, 2014
2.752
-3.389
-55.19%
jan 1, 2015
3.535
+0.783
28.45%
jan 1, 2016
4.426
+0.892
25.22%
Ranking of countries by current statistics by years


Comments: