29
/
en
AIzaSyAYiBZKx7MnpbEhh9jyipgxe19OcubqV5w
April 1, 2024
107342
Colombia
COL
true
2
1
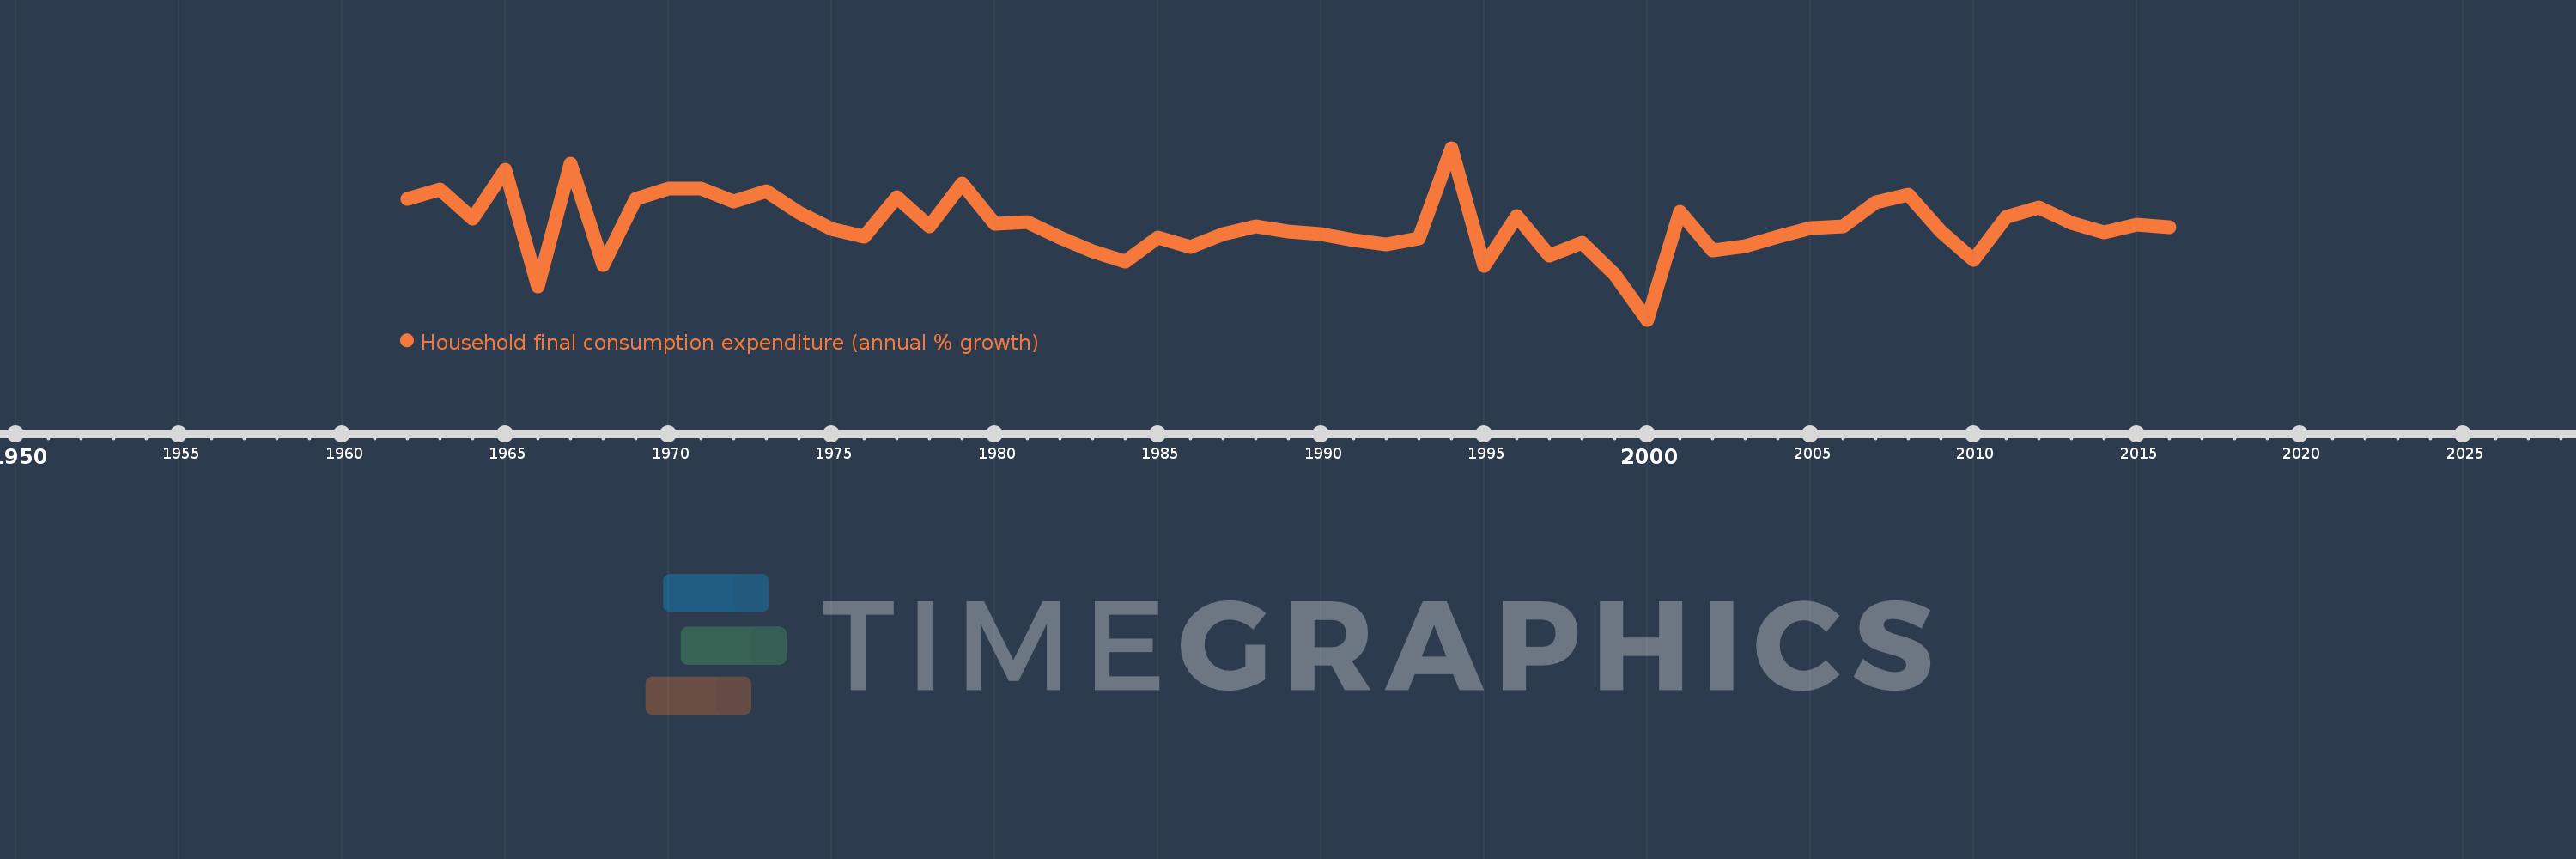
Household final consumption expenditure (annual % growth)
2016,2015,2014,2013,2012,2011,2010,2009,2008,2007,2006,2005,2004,2003,2002,2001,2000,1999,1998,1997,1996,1995,1994,1993,1992,1991,1990,1989,1988,1987,1986,1985,1984,1983,1982,1981,1980,1979,1978,1977,1976,1975,1974,1973,1972,1971,1970,1969,1968,1967,1966,1965,1964,1963,1962
This statistics in other country:
AlbaniaAlgeriaAntigua and BarbudaArab WorldArgentinaArmeniaAustraliaAustriaAzerbaijanBahamas, TheBahrainBangladeshBarbadosBelarusBelgiumBelizeBeninBhutanBoliviaBosnia and HerzegovinaBotswanaBrazilBrunei DarussalamBulgariaBurkina FasoBurundiCabo VerdeCambodiaCameroonCanadaCaribbean small statesCentral Europe and the BalticsChadChileChinaColombiaComorosCongo, Dem. Rep.Congo, Rep.Costa RicaCote d'IvoireCroatiaCubaCyprusCzech RepublicDenmarkDominican RepublicEarly-demographic dividendEast Asia & PacificEast Asia & Pacific (excluding high income)East Asia & Pacific (IDA & IBRD countries)EcuadorEgypt, Arab Rep.El SalvadorEquatorial GuineaEritreaEstoniaEthiopiaEuro areaEurope & Central AsiaEurope & Central Asia (excluding high income)Europe & Central Asia (IDA & IBRD countries)European UnionFinlandFranceGabonGambia, TheGeorgiaGermanyGhanaGreeceGuatemalaGuineaGuinea-BissauHaitiHeavily indebted poor countries (HIPC)High incomeHondurasHong Kong SAR, ChinaHungaryIBRD onlyIcelandIDA & IBRD totalIDA blendIDA onlyIDA totalIndiaIndonesiaIran, Islamic Rep.IrelandIsraelItalyJamaicaJapanJordanKazakhstanKenyaKorea, Rep.KosovoKuwaitKyrgyz RepublicLao PDRLate-demographic dividendLatin America & Caribbean Latin America & Caribbean (excluding high income)Latin America & the Caribbean (IDA & IBRD countries)LatviaLeast developed countries: UN classificationLebanonLiberiaLithuaniaLow & middle incomeLow incomeLower middle incomeLuxembourgMacao SAR, ChinaMacedonia, FYRMadagascarMalawiMalaysiaMaliMaltaMauritaniaMauritiusMexicoMiddle East & North AfricaMiddle East & North Africa (excluding high income)Middle East & North Africa (IDA & IBRD countries)Middle incomeMoldovaMongoliaMontenegroMoroccoMozambiqueNamibiaNepalNetherlandsNew ZealandNicaraguaNigerNigeriaNorth AmericaNorwayOECD membersOmanOther small statesPakistanPanamaPapua New GuineaParaguayPeruPhilippinesPolandPortugalPost-demographic dividendPre-demographic dividendPuerto RicoQatarRomaniaRussian FederationRwandaSaudi ArabiaSenegalSerbiaSeychellesSierra LeoneSingaporeSlovak RepublicSloveniaSmall statesSomaliaSouth AfricaSouth AsiaSouth Asia (IDA & IBRD)South SudanSpainSri LankaSub-Saharan Africa Sub-Saharan Africa (excluding high income)Sub-Saharan Africa (IDA & IBRD countries)SudanSurinameSwazilandSwedenSwitzerlandSyrian Arab RepublicTajikistanTanzaniaThailandTimor-LesteTogoTrinidad and TobagoTunisiaTurkeyTurkmenistanUgandaUkraineUnited Arab EmiratesUnited KingdomUnited StatesUpper middle incomeUruguayVanuatuVenezuela, RBVietnamWest Bank and GazaWorldZimbabwe Timeline:
This timeline shows a graph from 1962 to 2016 of Colombia. No data until 1961. Number of actual observations by date: 55.
Source name:
World Development Indicators
Source organization:
World Bank national accounts data, and OECD National Accounts data files.
Categories, topics:
Economy & Growth
Last updated:
apr 23, 2017
Indicators value changes by year
Minimum:
-5.495
jan 1, 2000
Maximum:
12.012
jan 1, 1994
At the date of observation
Value
Absolute change
Change from previous value
jan 1, 1962
6.85
+6.85
0.0%
jan 1, 1963
7.764
+0.914
13.34%
jan 1, 1964
4.851
-2.913
-37.52%
jan 1, 1965
9.831
+4.981
102.69%
jan 1, 1966
-2.133
-11.964
-121.69%
jan 1, 1967
10.412
+12.544
-588.19%
jan 1, 1968
0.11
-10.302
-98.95%
jan 1, 1969
6.791
+6.681
6.09K%
jan 1, 1970
7.846
+1.055
15.54%
jan 1, 1971
7.893
+0.047
0.6%
jan 1, 1972
6.567
-1.327
-16.81%
jan 1, 1973
7.568
+1.001
15.25%
jan 1, 1974
5.383
-2.186
-28.88%
jan 1, 1975
3.758
-1.625
-30.19%
jan 1, 1976
2.954
-0.804
-21.4%
jan 1, 1977
6.967
+4.014
135.89%
jan 1, 1978
4.055
-2.912
-41.8%
jan 1, 1979
8.377
+4.322
106.58%
jan 1, 1980
4.304
-4.073
-48.63%
jan 1, 1981
4.425
+0.121
2.81%
jan 1, 1982
2.911
-1.513
-34.2%
jan 1, 1983
1.49
-1.421
-48.81%
jan 1, 1984
0.448
-1.042
-69.94%
jan 1, 1985
2.849
+2.401
536.04%
jan 1, 1986
1.879
-0.97
-34.05%
jan 1, 1987
3.24
+1.36
72.4%
jan 1, 1988
4.008
+0.769
23.73%
jan 1, 1989
3.501
-0.507
-12.64%
jan 1, 1990
3.234
-0.267
-7.64%
jan 1, 1991
2.638
-0.596
-18.43%
jan 1, 1992
2.149
-0.489
-18.55%
jan 1, 1993
2.811
+0.662
30.83%
jan 1, 1994
12.012
+9.201
327.3%
jan 1, 1995
-0.014
-12.026
-100.12%
jan 1, 1996
5.047
+5.061
-36.18K%
jan 1, 1997
1.064
-3.982
-78.91%
jan 1, 1998
2.348
+1.284
120.63%
jan 1, 1999
-0.856
-3.204
-136.45%
jan 1, 2000
-5.495
-4.639
541.94%
jan 1, 2001
5.511
+11.006
-200.29%
jan 1, 2002
1.55
-3.961
-71.87%
jan 1, 2003
1.983
+0.433
27.91%
jan 1, 2004
2.959
+0.976
49.24%
jan 1, 2005
3.867
+0.908
30.67%
jan 1, 2006
4.048
+0.181
4.69%
jan 1, 2007
6.428
+2.379
58.77%
jan 1, 2008
7.267
+0.839
13.06%
jan 1, 2009
3.494
-3.773
-51.92%
jan 1, 2010
0.567
-2.927
-83.77%
jan 1, 2011
4.993
+4.426
780.25%
jan 1, 2012
5.977
+0.984
19.71%
jan 1, 2013
4.384
-1.594
-26.66%
jan 1, 2014
3.391
-0.993
-22.66%
jan 1, 2015
4.152
+0.762
22.47%
jan 1, 2016
3.946
-0.206
-4.97%
Ranking of countries by current statistics by years


Comments: