29
/
en
AIzaSyAYiBZKx7MnpbEhh9jyipgxe19OcubqV5w
April 1, 2024
84184
Benin
BEN
true
2
1
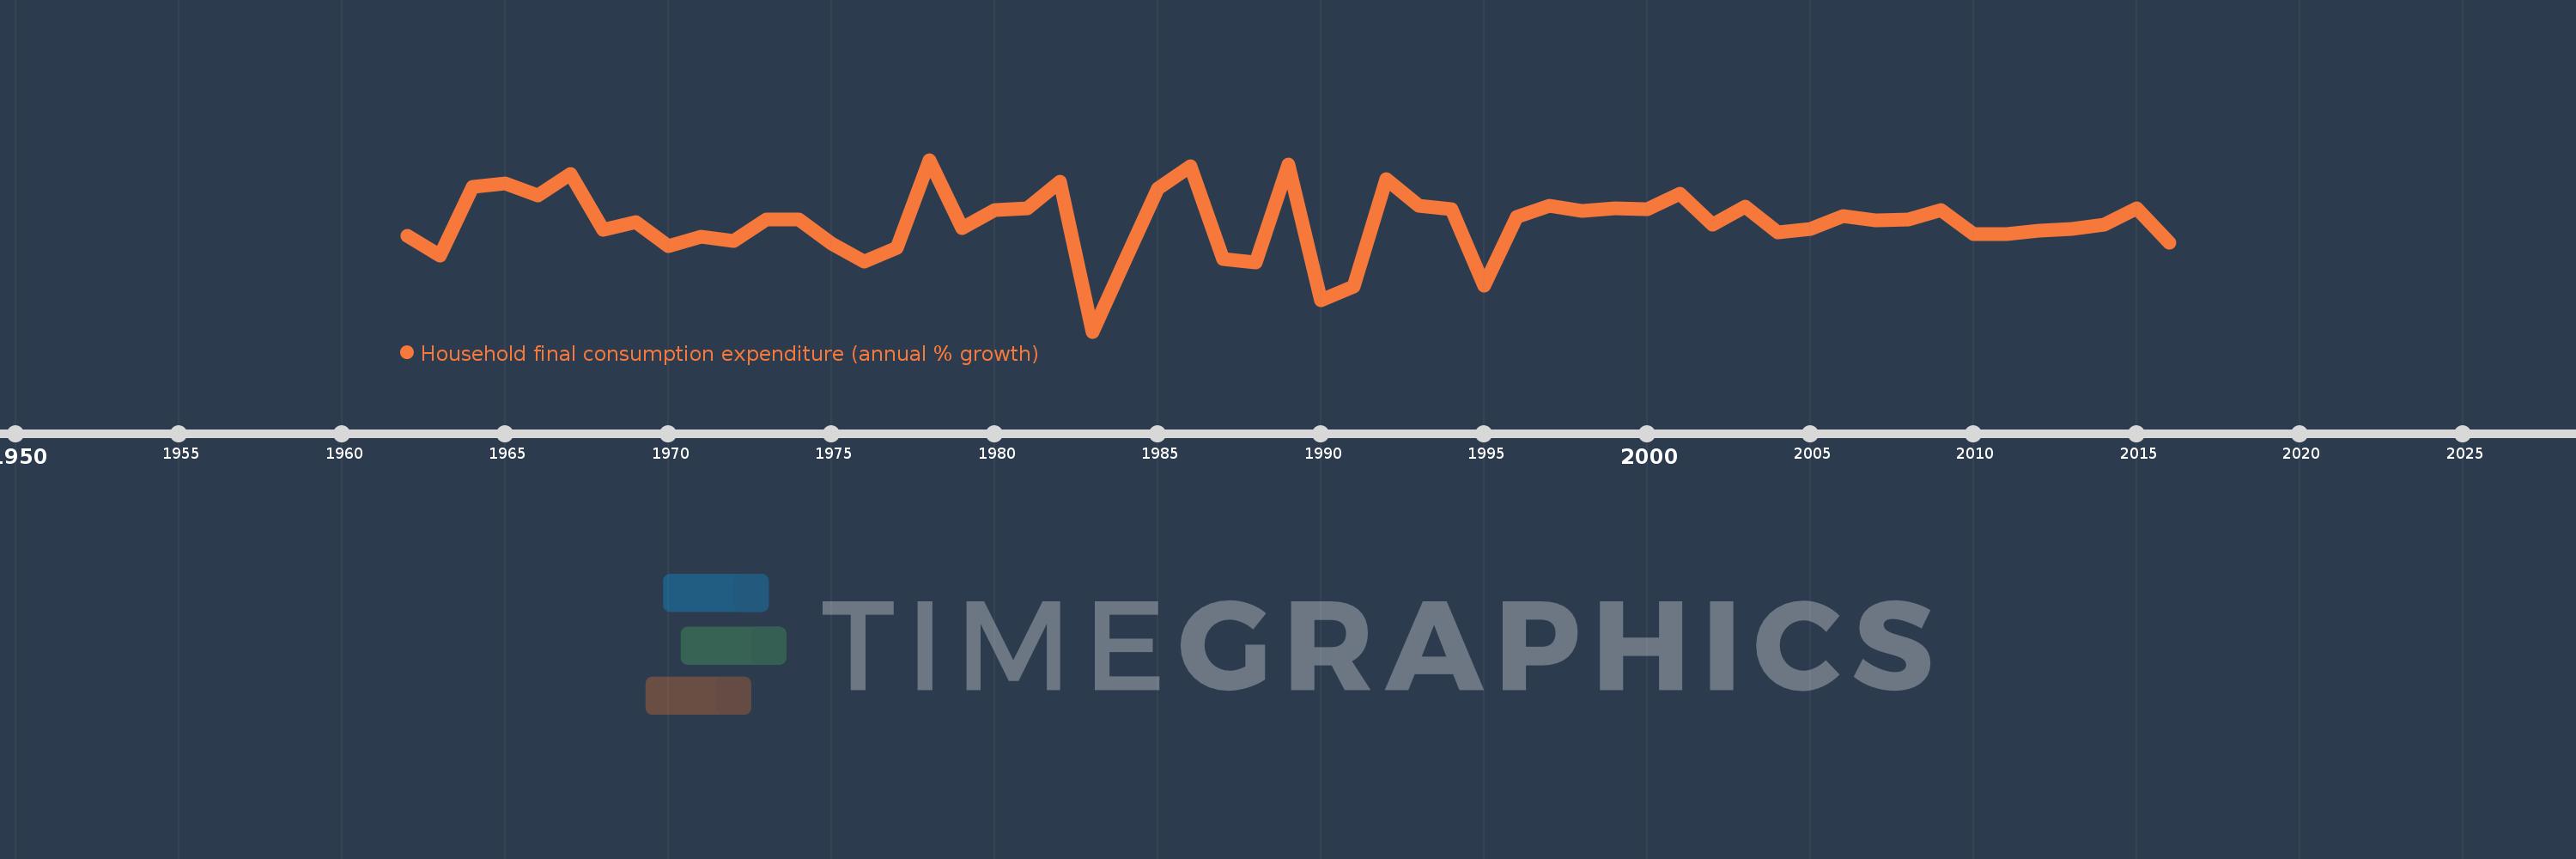
Household final consumption expenditure (annual % growth)
2016,2015,2014,2013,2012,2011,2010,2009,2008,2007,2006,2005,2004,2003,2002,2001,2000,1999,1998,1997,1996,1995,1994,1993,1992,1991,1990,1989,1988,1987,1986,1985,1984,1983,1982,1981,1980,1979,1978,1977,1976,1975,1974,1973,1972,1971,1970,1969,1968,1967,1966,1965,1964,1963,1962
This statistics in other country:
AlbaniaAlgeriaAntigua and BarbudaArab WorldArgentinaArmeniaAustraliaAustriaAzerbaijanBahamas, TheBahrainBangladeshBarbadosBelarusBelgiumBelizeBeninBhutanBoliviaBosnia and HerzegovinaBotswanaBrazilBrunei DarussalamBulgariaBurkina FasoBurundiCabo VerdeCambodiaCameroonCanadaCaribbean small statesCentral Europe and the BalticsChadChileChinaColombiaComorosCongo, Dem. Rep.Congo, Rep.Costa RicaCote d'IvoireCroatiaCubaCyprusCzech RepublicDenmarkDominican RepublicEarly-demographic dividendEast Asia & PacificEast Asia & Pacific (excluding high income)East Asia & Pacific (IDA & IBRD countries)EcuadorEgypt, Arab Rep.El SalvadorEquatorial GuineaEritreaEstoniaEthiopiaEuro areaEurope & Central AsiaEurope & Central Asia (excluding high income)Europe & Central Asia (IDA & IBRD countries)European UnionFinlandFranceGabonGambia, TheGeorgiaGermanyGhanaGreeceGuatemalaGuineaGuinea-BissauHaitiHeavily indebted poor countries (HIPC)High incomeHondurasHong Kong SAR, ChinaHungaryIBRD onlyIcelandIDA & IBRD totalIDA blendIDA onlyIDA totalIndiaIndonesiaIran, Islamic Rep.IrelandIsraelItalyJamaicaJapanJordanKazakhstanKenyaKorea, Rep.KosovoKuwaitKyrgyz RepublicLao PDRLate-demographic dividendLatin America & Caribbean Latin America & Caribbean (excluding high income)Latin America & the Caribbean (IDA & IBRD countries)LatviaLeast developed countries: UN classificationLebanonLiberiaLithuaniaLow & middle incomeLow incomeLower middle incomeLuxembourgMacao SAR, ChinaMacedonia, FYRMadagascarMalawiMalaysiaMaliMaltaMauritaniaMauritiusMexicoMiddle East & North AfricaMiddle East & North Africa (excluding high income)Middle East & North Africa (IDA & IBRD countries)Middle incomeMoldovaMongoliaMontenegroMoroccoMozambiqueNamibiaNepalNetherlandsNew ZealandNicaraguaNigerNigeriaNorth AmericaNorwayOECD membersOmanOther small statesPakistanPanamaPapua New GuineaParaguayPeruPhilippinesPolandPortugalPost-demographic dividendPre-demographic dividendPuerto RicoQatarRomaniaRussian FederationRwandaSaudi ArabiaSenegalSerbiaSeychellesSierra LeoneSingaporeSlovak RepublicSloveniaSmall statesSomaliaSouth AfricaSouth AsiaSouth Asia (IDA & IBRD)South SudanSpainSri LankaSub-Saharan Africa Sub-Saharan Africa (excluding high income)Sub-Saharan Africa (IDA & IBRD countries)SudanSurinameSwazilandSwedenSwitzerlandSyrian Arab RepublicTajikistanTanzaniaThailandTimor-LesteTogoTrinidad and TobagoTunisiaTurkeyTurkmenistanUgandaUkraineUnited Arab EmiratesUnited KingdomUnited StatesUpper middle incomeUruguayVanuatuVenezuela, RBVietnamWest Bank and GazaWorldZimbabwe Timeline:
This timeline shows a graph from 1962 to 2016 of Benin. No data until 1961. Number of actual observations by date: 55.
Source name:
World Development Indicators
Source organization:
World Bank national accounts data, and OECD National Accounts data files.
Categories, topics:
Economy & Growth
Last updated:
apr 23, 2017
Indicators value changes by year
Minimum:
-11.666
jan 1, 1983
Maximum:
12.143
jan 1, 1978
At the date of observation
Value
Absolute change
Change from previous value
jan 1, 1962
1.659
+1.659
0.0%
jan 1, 1963
-1.168
-2.827
-170.42%
jan 1, 1964
8.375
+9.544
-816.87%
jan 1, 1965
8.923
+0.547
6.53%
jan 1, 1966
7.215
-1.708
-19.14%
jan 1, 1967
10.189
+2.974
41.22%
jan 1, 1968
2.417
-7.772
-76.28%
jan 1, 1969
3.456
+1.039
43.0%
jan 1, 1970
0.237
-3.219
-93.15%
jan 1, 1971
1.544
+1.307
552.27%
jan 1, 1972
0.946
-0.598
-38.73%
jan 1, 1973
3.913
+2.967
313.64%
jan 1, 1974
3.841
-0.072
-1.84%
jan 1, 1975
0.564
-3.277
-85.32%
jan 1, 1976
-1.984
-2.548
-451.81%
jan 1, 1977
-0.107
+1.877
-94.61%
jan 1, 1978
12.143
+12.25
-11.46K%
jan 1, 1979
2.719
-9.424
-77.61%
jan 1, 1980
5.221
+2.502
92.02%
jan 1, 1981
5.422
+0.201
3.85%
jan 1, 1982
9.118
+3.696
68.17%
jan 1, 1983
-11.666
-20.784
-227.94%
jan 1, 1984
-1.678
+9.988
-85.62%
jan 1, 1985
8.132
+9.81
-584.68%
jan 1, 1986
11.223
+3.091
38.01%
jan 1, 1987
-1.605
-12.828
-114.31%
jan 1, 1988
-2.106
-0.501
31.19%
jan 1, 1989
11.437
+13.543
-643.03%
jan 1, 1990
-7.294
-18.731
-163.77%
jan 1, 1991
-5.428
+1.866
-25.58%
jan 1, 1992
9.486
+14.914
-274.76%
jan 1, 1993
5.827
-3.659
-38.57%
jan 1, 1994
5.29
-0.537
-9.22%
jan 1, 1995
-5.313
-10.603
-200.43%
jan 1, 1996
4.228
+9.541
-179.57%
jan 1, 1997
5.731
+1.503
35.55%
jan 1, 1998
5.019
-0.712
-12.42%
jan 1, 1999
5.45
+0.431
8.58%
jan 1, 2000
5.318
-0.132
-2.43%
jan 1, 2001
7.499
+2.181
41.02%
jan 1, 2002
3.108
-4.391
-58.56%
jan 1, 2003
5.694
+2.587
83.24%
jan 1, 2004
2.093
-3.601
-63.24%
jan 1, 2005
2.549
+0.456
21.79%
jan 1, 2006
4.326
+1.777
69.72%
jan 1, 2007
3.736
-0.59
-13.64%
jan 1, 2008
3.856
+0.12
3.2%
jan 1, 2009
5.171
+1.316
34.12%
jan 1, 2010
1.87
-3.301
-63.84%
jan 1, 2011
1.796
-0.074
-3.95%
jan 1, 2012
2.347
+0.551
30.66%
jan 1, 2013
2.55
+0.203
8.66%
jan 1, 2014
3.149
+0.598
23.46%
jan 1, 2015
5.428
+2.279
72.38%
jan 1, 2016
0.684
-4.744
-87.39%
Ranking of countries by current statistics by years


Comments: