29
/
en
AIzaSyAYiBZKx7MnpbEhh9jyipgxe19OcubqV5w
April 1, 2024
81839
Belgium
BEL
true
2
1
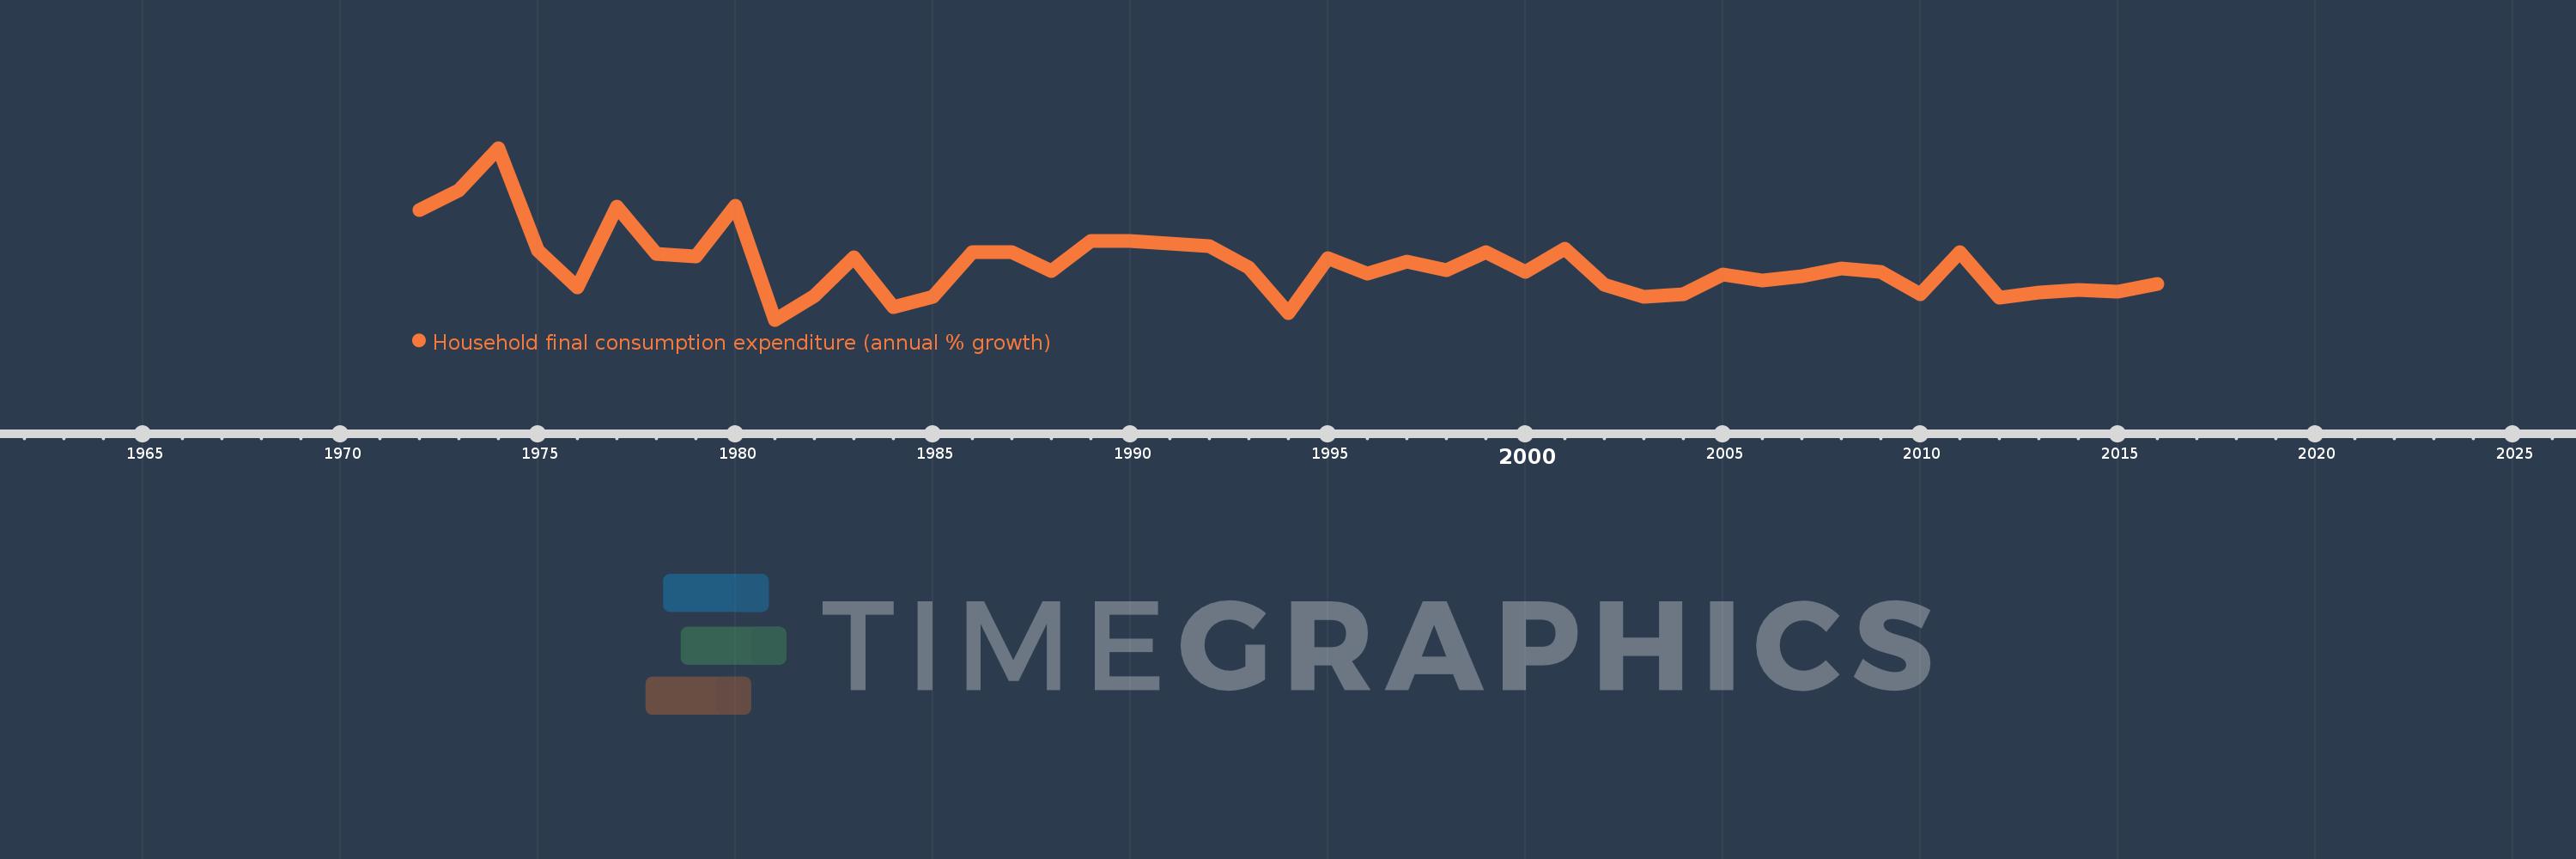
Household final consumption expenditure (annual % growth)
2016,2015,2014,2013,2012,2011,2010,2009,2008,2007,2006,2005,2004,2003,2002,2001,2000,1999,1998,1997,1996,1995,1994,1993,1992,1991,1990,1989,1988,1987,1986,1985,1984,1983,1982,1981,1980,1979,1978,1977,1976,1975,1974,1973,1972
This statistics in other country:
AlbaniaAlgeriaAntigua and BarbudaArab WorldArgentinaArmeniaAustraliaAustriaAzerbaijanBahamas, TheBahrainBangladeshBarbadosBelarusBelgiumBelizeBeninBhutanBoliviaBosnia and HerzegovinaBotswanaBrazilBrunei DarussalamBulgariaBurkina FasoBurundiCabo VerdeCambodiaCameroonCanadaCaribbean small statesCentral Europe and the BalticsChadChileChinaColombiaComorosCongo, Dem. Rep.Congo, Rep.Costa RicaCote d'IvoireCroatiaCubaCyprusCzech RepublicDenmarkDominican RepublicEarly-demographic dividendEast Asia & PacificEast Asia & Pacific (excluding high income)East Asia & Pacific (IDA & IBRD countries)EcuadorEgypt, Arab Rep.El SalvadorEquatorial GuineaEritreaEstoniaEthiopiaEuro areaEurope & Central AsiaEurope & Central Asia (excluding high income)Europe & Central Asia (IDA & IBRD countries)European UnionFinlandFranceGabonGambia, TheGeorgiaGermanyGhanaGreeceGuatemalaGuineaGuinea-BissauHaitiHeavily indebted poor countries (HIPC)High incomeHondurasHong Kong SAR, ChinaHungaryIBRD onlyIcelandIDA & IBRD totalIDA blendIDA onlyIDA totalIndiaIndonesiaIran, Islamic Rep.IrelandIsraelItalyJamaicaJapanJordanKazakhstanKenyaKorea, Rep.KosovoKuwaitKyrgyz RepublicLao PDRLate-demographic dividendLatin America & Caribbean Latin America & Caribbean (excluding high income)Latin America & the Caribbean (IDA & IBRD countries)LatviaLeast developed countries: UN classificationLebanonLiberiaLithuaniaLow & middle incomeLow incomeLower middle incomeLuxembourgMacao SAR, ChinaMacedonia, FYRMadagascarMalawiMalaysiaMaliMaltaMauritaniaMauritiusMexicoMiddle East & North AfricaMiddle East & North Africa (excluding high income)Middle East & North Africa (IDA & IBRD countries)Middle incomeMoldovaMongoliaMontenegroMoroccoMozambiqueNamibiaNepalNetherlandsNew ZealandNicaraguaNigerNigeriaNorth AmericaNorwayOECD membersOmanOther small statesPakistanPanamaPapua New GuineaParaguayPeruPhilippinesPolandPortugalPost-demographic dividendPre-demographic dividendPuerto RicoQatarRomaniaRussian FederationRwandaSaudi ArabiaSenegalSerbiaSeychellesSierra LeoneSingaporeSlovak RepublicSloveniaSmall statesSomaliaSouth AfricaSouth AsiaSouth Asia (IDA & IBRD)South SudanSpainSri LankaSub-Saharan Africa Sub-Saharan Africa (excluding high income)Sub-Saharan Africa (IDA & IBRD countries)SudanSurinameSwazilandSwedenSwitzerlandSyrian Arab RepublicTajikistanTanzaniaThailandTimor-LesteTogoTrinidad and TobagoTunisiaTurkeyTurkmenistanUgandaUkraineUnited Arab EmiratesUnited KingdomUnited StatesUpper middle incomeUruguayVanuatuVenezuela, RBVietnamWest Bank and GazaWorldZimbabwe Timeline:
This timeline shows a graph from 1972 to 2016 of Belgium. No data until 1971. Number of actual observations by date: 45.
Source name:
World Development Indicators
Source organization:
World Bank national accounts data, and OECD National Accounts data files.
Categories, topics:
Economy & Growth
Last updated:
apr 23, 2017
Indicators value changes by year
Minimum:
-0.813
jan 1, 1981
At the date of observation
Value
Absolute change
Change from previous value
jan 1, 1972
4.919
+4.919
0.0%
jan 1, 1973
5.919
+1.0
20.33%
jan 1, 1974
8.15
+2.231
37.68%
jan 1, 1975
2.804
-5.346
-65.59%
jan 1, 1976
0.856
-1.949
-69.49%
jan 1, 1977
5.084
+4.228
494.12%
jan 1, 1978
2.631
-2.453
-48.25%
jan 1, 1979
2.496
-0.135
-5.13%
jan 1, 1980
5.131
+2.635
105.56%
jan 1, 1981
-0.813
-5.944
-115.84%
jan 1, 1982
0.418
+1.231
-151.42%
jan 1, 1983
2.439
+2.021
483.47%
jan 1, 1984
-0.15
-2.589
-106.16%
jan 1, 1985
0.369
+0.519
-345.69%
jan 1, 1986
2.708
+2.339
633.95%
jan 1, 1987
2.719
+0.01
0.39%
jan 1, 1988
1.735
-0.984
-36.18%
jan 1, 1989
3.318
+1.583
91.2%
jan 1, 1990
3.308
-0.01
-0.31%
jan 1, 1991
3.175
-0.133
-4.03%
jan 1, 1992
3.02
-0.154
-4.86%
jan 1, 1993
1.908
-1.112
-36.82%
jan 1, 1994
-0.448
-2.357
-123.5%
jan 1, 1995
2.395
+2.843
-634.18%
jan 1, 1996
1.576
-0.819
-34.19%
jan 1, 1997
2.204
+0.627
39.81%
jan 1, 1998
1.788
-0.416
-18.88%
jan 1, 1999
2.718
+0.93
52.03%
jan 1, 2000
1.681
-1.037
-38.15%
jan 1, 2001
2.905
+1.224
72.8%
jan 1, 2002
1.012
-1.892
-65.15%
jan 1, 2003
0.4
-0.612
-60.45%
jan 1, 2004
0.518
+0.117
29.25%
jan 1, 2005
1.561
+1.043
201.54%
jan 1, 2006
1.23
-0.33
-21.17%
jan 1, 2007
1.472
+0.241
19.6%
jan 1, 2008
1.853
+0.382
25.94%
jan 1, 2009
1.696
-0.157
-8.47%
jan 1, 2010
0.512
-1.184
-69.78%
jan 1, 2011
2.706
+2.193
427.96%
jan 1, 2012
0.343
-2.363
-87.31%
jan 1, 2013
0.591
+0.248
72.25%
jan 1, 2014
0.745
+0.154
26.01%
jan 1, 2015
0.644
-0.101
-13.55%
jan 1, 2016
1.059
+0.414
64.34%
Ranking of countries by current statistics by years


Comments: