29
/
en
AIzaSyAYiBZKx7MnpbEhh9jyipgxe19OcubqV5w
April 1, 2024
62665
World
WLD
false
2
1
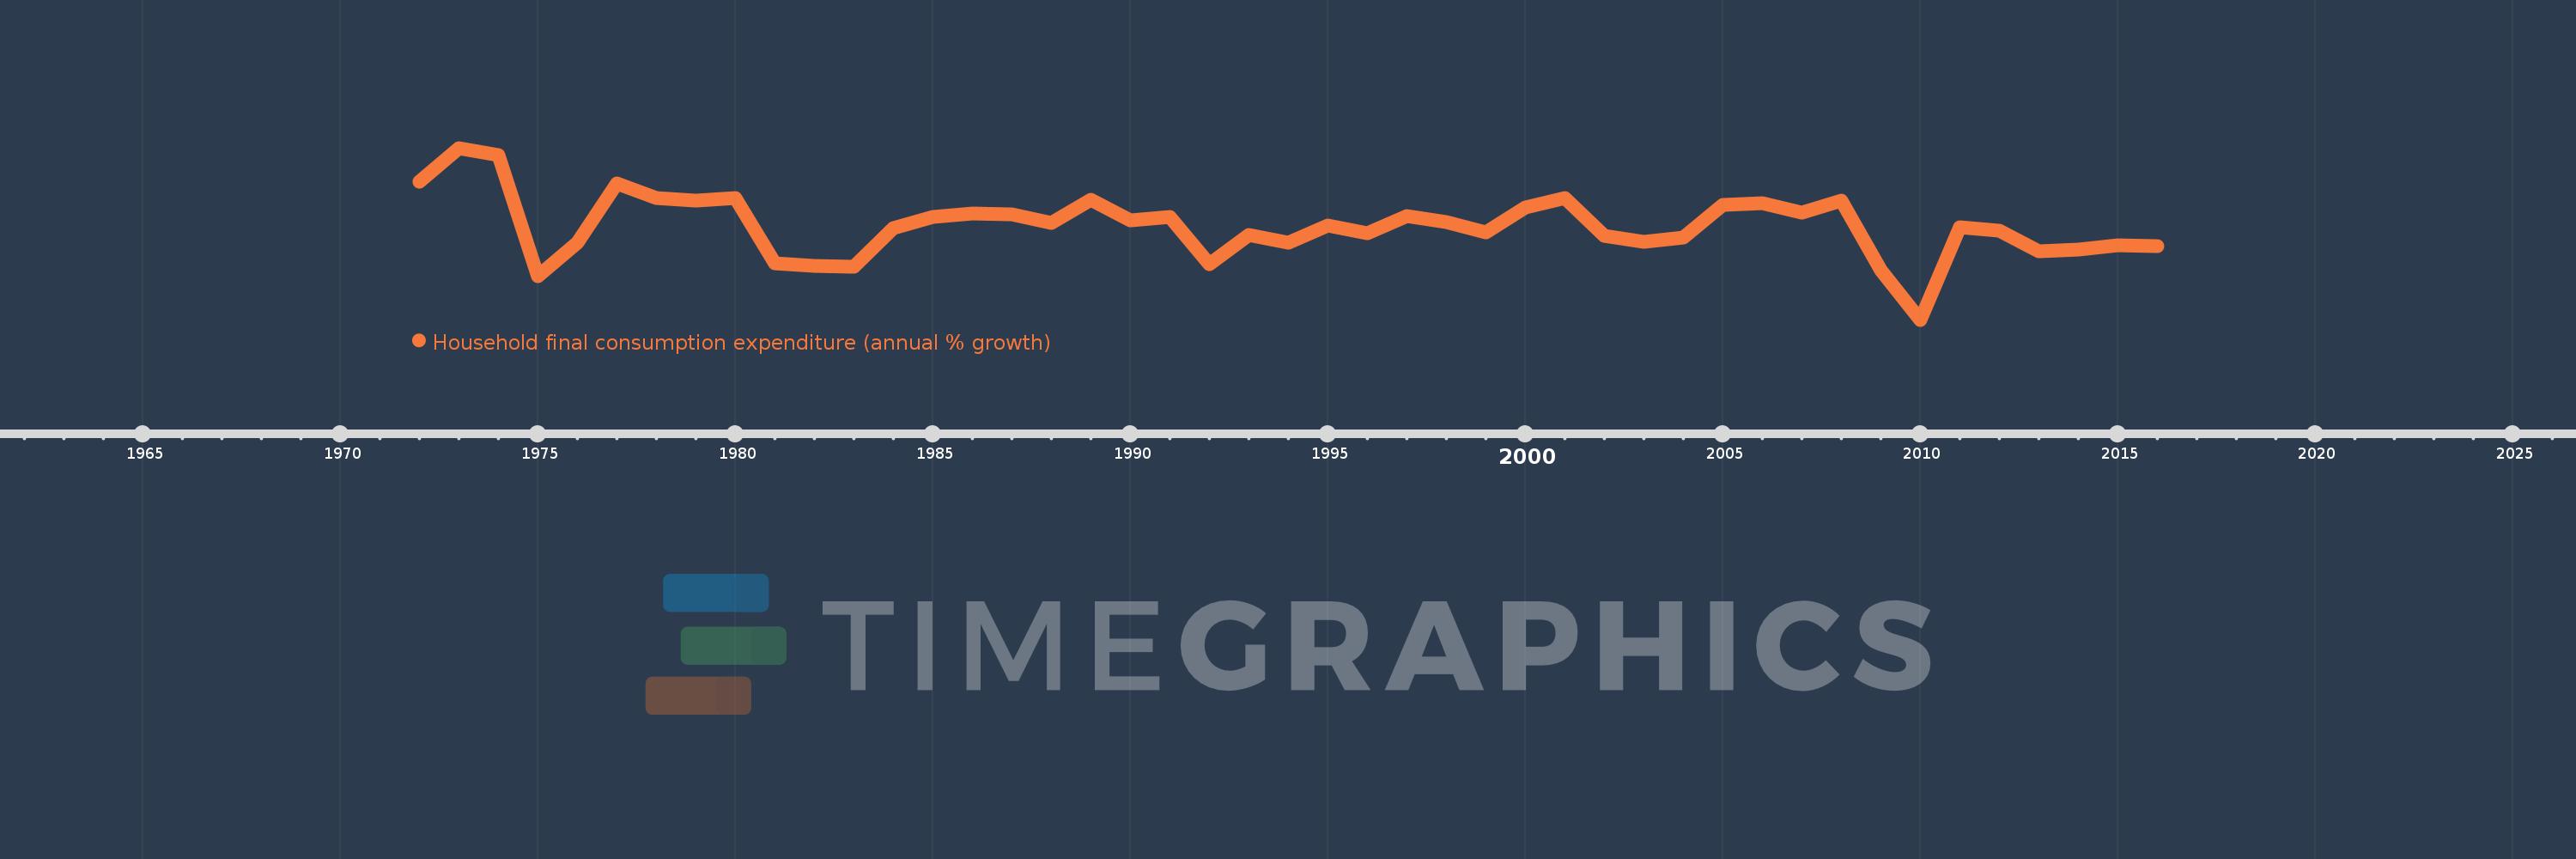
Household final consumption expenditure (annual % growth)
2016,2015,2014,2013,2012,2011,2010,2009,2008,2007,2006,2005,2004,2003,2002,2001,2000,1999,1998,1997,1996,1995,1994,1993,1992,1991,1990,1989,1988,1987,1986,1985,1984,1983,1982,1981,1980,1979,1978,1977,1976,1975,1974,1973,1972
This statistics in other country:
AlbaniaAlgeriaAntigua and BarbudaArab WorldArgentinaArmeniaAustraliaAustriaAzerbaijanBahamas, TheBahrainBangladeshBarbadosBelarusBelgiumBelizeBeninBhutanBoliviaBosnia and HerzegovinaBotswanaBrazilBrunei DarussalamBulgariaBurkina FasoBurundiCabo VerdeCambodiaCameroonCanadaCaribbean small statesCentral Europe and the BalticsChadChileChinaColombiaComorosCongo, Dem. Rep.Congo, Rep.Costa RicaCote d'IvoireCroatiaCubaCyprusCzech RepublicDenmarkDominican RepublicEarly-demographic dividendEast Asia & PacificEast Asia & Pacific (excluding high income)East Asia & Pacific (IDA & IBRD countries)EcuadorEgypt, Arab Rep.El SalvadorEquatorial GuineaEritreaEstoniaEthiopiaEuro areaEurope & Central AsiaEurope & Central Asia (excluding high income)Europe & Central Asia (IDA & IBRD countries)European UnionFinlandFranceGabonGambia, TheGeorgiaGermanyGhanaGreeceGuatemalaGuineaGuinea-BissauHaitiHeavily indebted poor countries (HIPC)High incomeHondurasHong Kong SAR, ChinaHungaryIBRD onlyIcelandIDA & IBRD totalIDA blendIDA onlyIDA totalIndiaIndonesiaIran, Islamic Rep.IrelandIsraelItalyJamaicaJapanJordanKazakhstanKenyaKorea, Rep.KosovoKuwaitKyrgyz RepublicLao PDRLate-demographic dividendLatin America & Caribbean Latin America & Caribbean (excluding high income)Latin America & the Caribbean (IDA & IBRD countries)LatviaLeast developed countries: UN classificationLebanonLiberiaLithuaniaLow & middle incomeLow incomeLower middle incomeLuxembourgMacao SAR, ChinaMacedonia, FYRMadagascarMalawiMalaysiaMaliMaltaMauritaniaMauritiusMexicoMiddle East & North AfricaMiddle East & North Africa (excluding high income)Middle East & North Africa (IDA & IBRD countries)Middle incomeMoldovaMongoliaMontenegroMoroccoMozambiqueNamibiaNepalNetherlandsNew ZealandNicaraguaNigerNigeriaNorth AmericaNorwayOECD membersOmanOther small statesPakistanPanamaPapua New GuineaParaguayPeruPhilippinesPolandPortugalPost-demographic dividendPre-demographic dividendPuerto RicoQatarRomaniaRussian FederationRwandaSaudi ArabiaSenegalSerbiaSeychellesSierra LeoneSingaporeSlovak RepublicSloveniaSmall statesSomaliaSouth AfricaSouth AsiaSouth Asia (IDA & IBRD)South SudanSpainSri LankaSub-Saharan Africa Sub-Saharan Africa (excluding high income)Sub-Saharan Africa (IDA & IBRD countries)SudanSurinameSwazilandSwedenSwitzerlandSyrian Arab RepublicTajikistanTanzaniaThailandTimor-LesteTogoTrinidad and TobagoTunisiaTurkeyTurkmenistanUgandaUkraineUnited Arab EmiratesUnited KingdomUnited StatesUpper middle incomeUruguayVanuatuVenezuela, RBVietnamWest Bank and GazaWorldZimbabwe Timeline:
This timeline shows a graph from 1972 to 2016 of World. No data until 1971. Number of actual observations by date: 45.
Source name:
World Development Indicators
Source organization:
World Bank national accounts data, and OECD National Accounts data files.
Categories, topics:
Economy & Growth
Last updated:
apr 23, 2017
Indicators value changes by year
Minimum:
-0.255
jan 1, 2010
At the date of observation
Value
Absolute change
Change from previous value
jan 1, 1972
4.681
+4.681
0.0%
jan 1, 1973
5.904
+1.223
26.12%
jan 1, 1974
5.663
-0.242
-4.1%
jan 1, 1975
1.32
-4.343
-76.69%
jan 1, 1976
2.499
+1.179
89.36%
jan 1, 1977
4.635
+2.136
85.45%
jan 1, 1978
4.102
-0.533
-11.5%
jan 1, 1979
4.005
-0.097
-2.37%
jan 1, 1980
4.118
+0.113
2.82%
jan 1, 1981
1.768
-2.35
-57.07%
jan 1, 1982
1.673
-0.095
-5.38%
jan 1, 1983
1.633
-0.04
-2.39%
jan 1, 1984
3.041
+1.408
86.24%
jan 1, 1985
3.423
+0.382
12.57%
jan 1, 1986
3.552
+0.129
3.78%
jan 1, 1987
3.52
-0.033
-0.92%
jan 1, 1988
3.216
-0.304
-8.64%
jan 1, 1989
4.046
+0.83
25.8%
jan 1, 1990
3.302
-0.744
-18.38%
jan 1, 1991
3.416
+0.114
3.47%
jan 1, 1992
1.724
-1.693
-49.54%
jan 1, 1993
2.791
+1.067
61.9%
jan 1, 1994
2.5
-0.291
-10.42%
jan 1, 1995
3.111
+0.611
24.44%
jan 1, 1996
2.843
-0.268
-8.62%
jan 1, 1997
3.463
+0.62
21.82%
jan 1, 1998
3.235
-0.228
-6.6%
jan 1, 1999
2.875
-0.359
-11.11%
jan 1, 2000
3.776
+0.9
31.32%
jan 1, 2001
4.099
+0.324
8.57%
jan 1, 2002
2.745
-1.354
-33.03%
jan 1, 2003
2.53
-0.215
-7.84%
jan 1, 2004
2.703
+0.173
6.83%
jan 1, 2005
3.854
+1.151
42.59%
jan 1, 2006
3.918
+0.064
1.66%
jan 1, 2007
3.584
-0.334
-8.53%
jan 1, 2008
4.028
+0.445
12.41%
jan 1, 2009
1.533
-2.495
-61.94%
jan 1, 2010
-0.255
-1.788
-116.6%
jan 1, 2011
3.075
+3.329
-1.31K%
jan 1, 2012
2.953
-0.122
-3.95%
jan 1, 2013
2.208
-0.745
-25.23%
jan 1, 2014
2.273
+0.064
2.92%
jan 1, 2015
2.412
+0.139
6.13%
jan 1, 2016
2.375
-0.037
-1.54%
Ranking of countries by current statistics by years


Comments: