29
/
en
AIzaSyAYiBZKx7MnpbEhh9jyipgxe19OcubqV5w
April 1, 2024
225993
Portugal
PRT
true
2
1
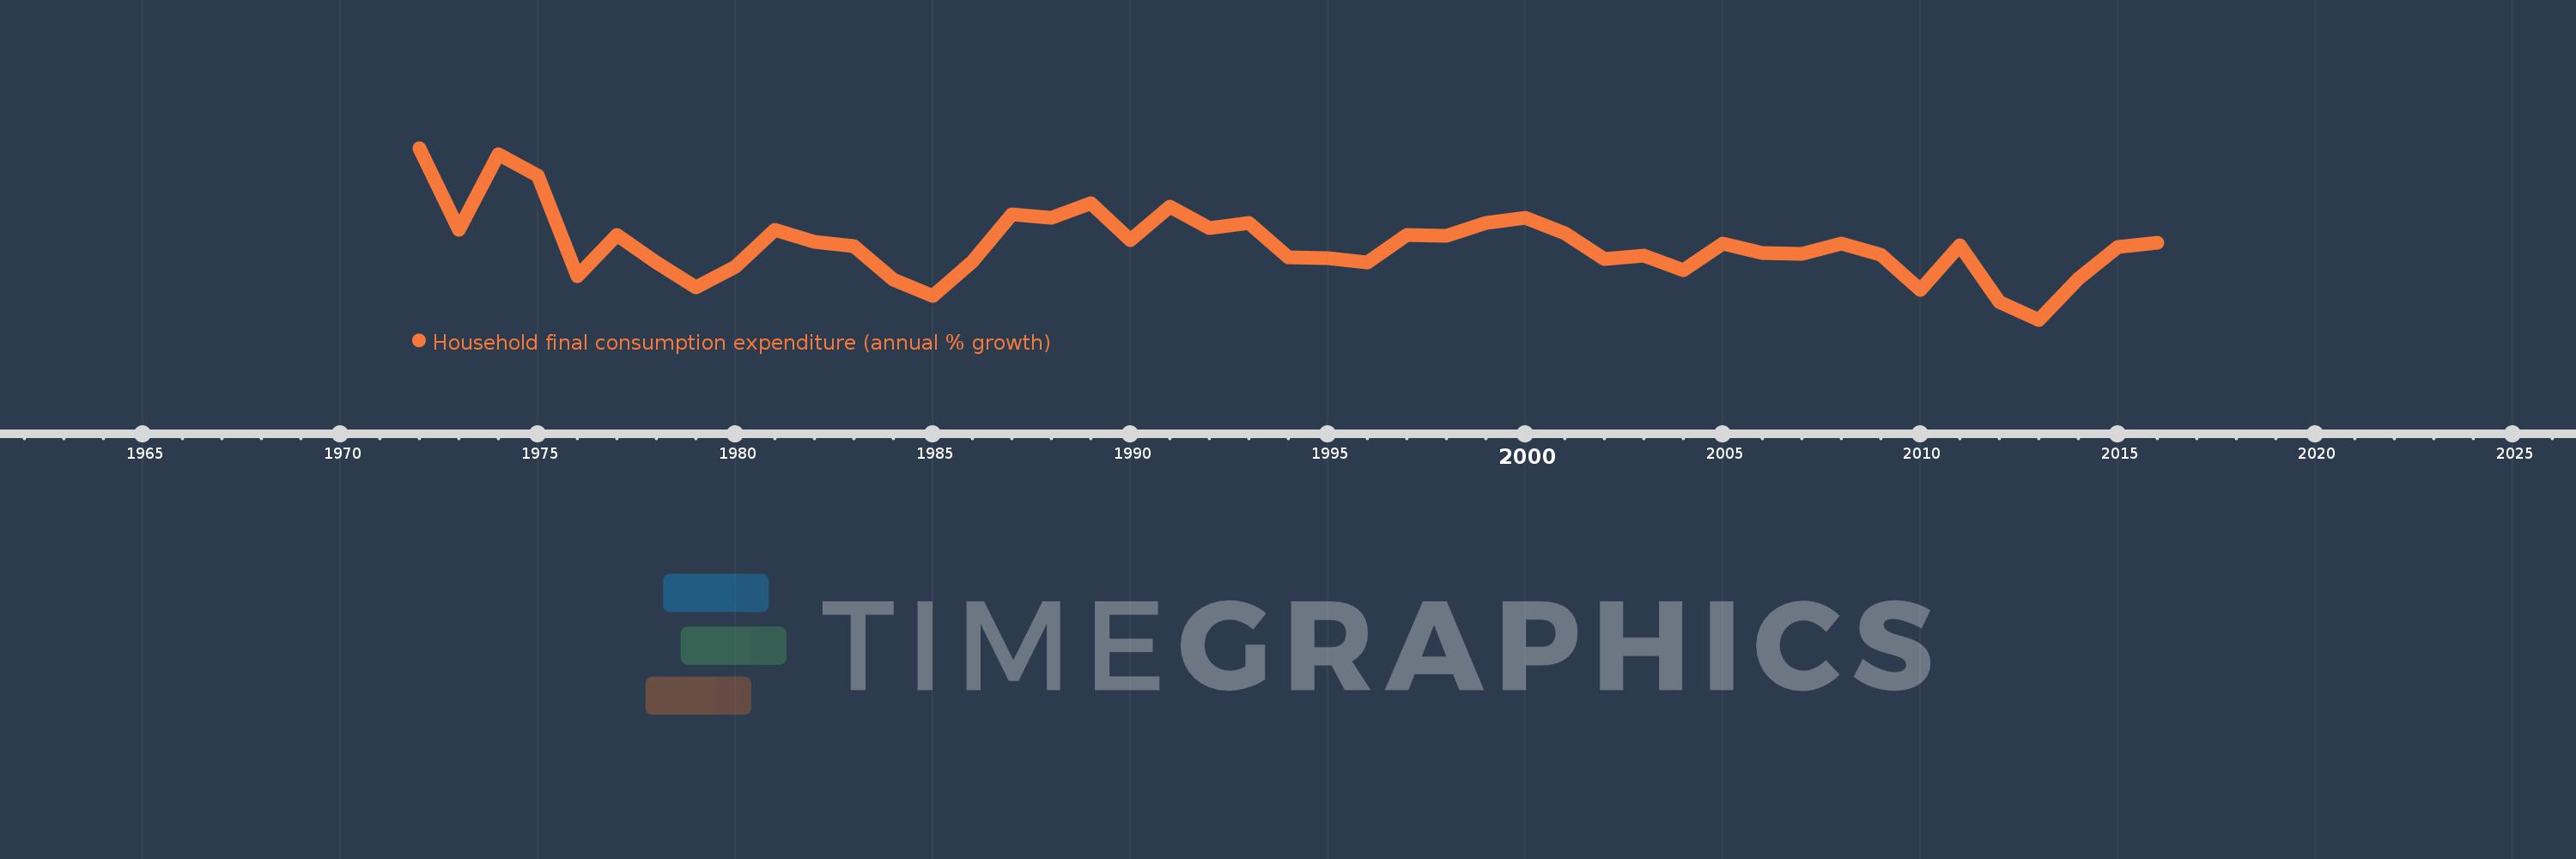
Household final consumption expenditure (annual % growth)
2016,2015,2014,2013,2012,2011,2010,2009,2008,2007,2006,2005,2004,2003,2002,2001,2000,1999,1998,1997,1996,1995,1994,1993,1992,1991,1990,1989,1988,1987,1986,1985,1984,1983,1982,1981,1980,1979,1978,1977,1976,1975,1974,1973,1972
This statistics in other country:
AlbaniaAlgeriaAntigua and BarbudaArab WorldArgentinaArmeniaAustraliaAustriaAzerbaijanBahamas, TheBahrainBangladeshBarbadosBelarusBelgiumBelizeBeninBhutanBoliviaBosnia and HerzegovinaBotswanaBrazilBrunei DarussalamBulgariaBurkina FasoBurundiCabo VerdeCambodiaCameroonCanadaCaribbean small statesCentral Europe and the BalticsChadChileChinaColombiaComorosCongo, Dem. Rep.Congo, Rep.Costa RicaCote d'IvoireCroatiaCubaCyprusCzech RepublicDenmarkDominican RepublicEarly-demographic dividendEast Asia & PacificEast Asia & Pacific (excluding high income)East Asia & Pacific (IDA & IBRD countries)EcuadorEgypt, Arab Rep.El SalvadorEquatorial GuineaEritreaEstoniaEthiopiaEuro areaEurope & Central AsiaEurope & Central Asia (excluding high income)Europe & Central Asia (IDA & IBRD countries)European UnionFinlandFranceGabonGambia, TheGeorgiaGermanyGhanaGreeceGuatemalaGuineaGuinea-BissauHaitiHeavily indebted poor countries (HIPC)High incomeHondurasHong Kong SAR, ChinaHungaryIBRD onlyIcelandIDA & IBRD totalIDA blendIDA onlyIDA totalIndiaIndonesiaIran, Islamic Rep.IrelandIsraelItalyJamaicaJapanJordanKazakhstanKenyaKorea, Rep.KosovoKuwaitKyrgyz RepublicLao PDRLate-demographic dividendLatin America & Caribbean Latin America & Caribbean (excluding high income)Latin America & the Caribbean (IDA & IBRD countries)LatviaLeast developed countries: UN classificationLebanonLiberiaLithuaniaLow & middle incomeLow incomeLower middle incomeLuxembourgMacao SAR, ChinaMacedonia, FYRMadagascarMalawiMalaysiaMaliMaltaMauritaniaMauritiusMexicoMiddle East & North AfricaMiddle East & North Africa (excluding high income)Middle East & North Africa (IDA & IBRD countries)Middle incomeMoldovaMongoliaMontenegroMoroccoMozambiqueNamibiaNepalNetherlandsNew ZealandNicaraguaNigerNigeriaNorth AmericaNorwayOECD membersOmanOther small statesPakistanPanamaPapua New GuineaParaguayPeruPhilippinesPolandPortugalPost-demographic dividendPre-demographic dividendPuerto RicoQatarRomaniaRussian FederationRwandaSaudi ArabiaSenegalSerbiaSeychellesSierra LeoneSingaporeSlovak RepublicSloveniaSmall statesSomaliaSouth AfricaSouth AsiaSouth Asia (IDA & IBRD)South SudanSpainSri LankaSub-Saharan Africa Sub-Saharan Africa (excluding high income)Sub-Saharan Africa (IDA & IBRD countries)SudanSurinameSwazilandSwedenSwitzerlandSyrian Arab RepublicTajikistanTanzaniaThailandTimor-LesteTogoTrinidad and TobagoTunisiaTurkeyTurkmenistanUgandaUkraineUnited Arab EmiratesUnited KingdomUnited StatesUpper middle incomeUruguayVanuatuVenezuela, RBVietnamWest Bank and GazaWorldZimbabwe Timeline:
This timeline shows a graph from 1972 to 2016 of Portugal. No data until 1971. Number of actual observations by date: 45.
Source name:
World Development Indicators
Source organization:
World Bank national accounts data, and OECD National Accounts data files.
Categories, topics:
Economy & Growth
Last updated:
apr 23, 2017
Indicators value changes by year
Minimum:
-5.494
jan 1, 2013
Maximum:
12.682
jan 1, 1972
At the date of observation
Value
Absolute change
Change from previous value
jan 1, 1972
12.682
+12.682
0.0%
jan 1, 1973
4.027
-8.654
-68.24%
jan 1, 1974
12.023
+7.996
198.55%
jan 1, 1975
9.739
-2.284
-19.0%
jan 1, 1976
-0.885
-10.624
-109.09%
jan 1, 1977
3.5
+4.385
-495.52%
jan 1, 1978
0.6
-2.9
-82.86%
jan 1, 1979
-2.038
-2.638
-439.75%
jan 1, 1980
0.114
+2.152
-105.59%
jan 1, 1981
4.026
+3.912
3.43K%
jan 1, 1982
2.759
-1.267
-31.48%
jan 1, 1983
2.296
-0.462
-16.76%
jan 1, 1984
-1.236
-3.532
-153.81%
jan 1, 1985
-3.0
-1.764
142.79%
jan 1, 1986
0.641
+3.64
-121.36%
jan 1, 1987
5.637
+4.997
779.85%
jan 1, 1988
5.286
-0.351
-6.23%
jan 1, 1989
6.826
+1.54
29.13%
jan 1, 1990
2.943
-3.883
-56.88%
jan 1, 1991
6.439
+3.496
118.77%
jan 1, 1992
4.229
-2.209
-34.31%
jan 1, 1993
4.737
+0.507
11.99%
jan 1, 1994
1.102
-3.635
-76.74%
jan 1, 1995
1.025
-0.077
-6.94%
jan 1, 1996
0.596
-0.429
-41.86%
jan 1, 1997
3.516
+2.92
489.85%
jan 1, 1998
3.34
-0.176
-5.01%
jan 1, 1999
4.793
+1.453
43.49%
jan 1, 2000
5.255
+0.462
9.64%
jan 1, 2001
3.69
-1.565
-29.78%
jan 1, 2002
0.949
-2.741
-74.27%
jan 1, 2003
1.313
+0.363
38.29%
jan 1, 2004
-0.274
-1.587
-120.86%
jan 1, 2005
2.559
+2.833
-1.03K%
jan 1, 2006
1.586
-0.974
-38.04%
jan 1, 2007
1.506
-0.08
-5.04%
jan 1, 2008
2.524
+1.018
67.58%
jan 1, 2009
1.375
-1.149
-45.52%
jan 1, 2010
-2.337
-3.712
-269.93%
jan 1, 2011
2.398
+4.734
-202.61%
jan 1, 2012
-3.604
-6.002
-250.34%
jan 1, 2013
-5.494
-1.889
52.42%
jan 1, 2014
-1.198
+4.296
-78.2%
jan 1, 2015
2.245
+3.443
-287.49%
jan 1, 2016
2.618
+0.373
16.59%
Ranking of countries by current statistics by years


Comments: