29
/
en
AIzaSyAYiBZKx7MnpbEhh9jyipgxe19OcubqV5w
April 1, 2024
151662
Hong Kong SAR, China
HKG
true
2
1
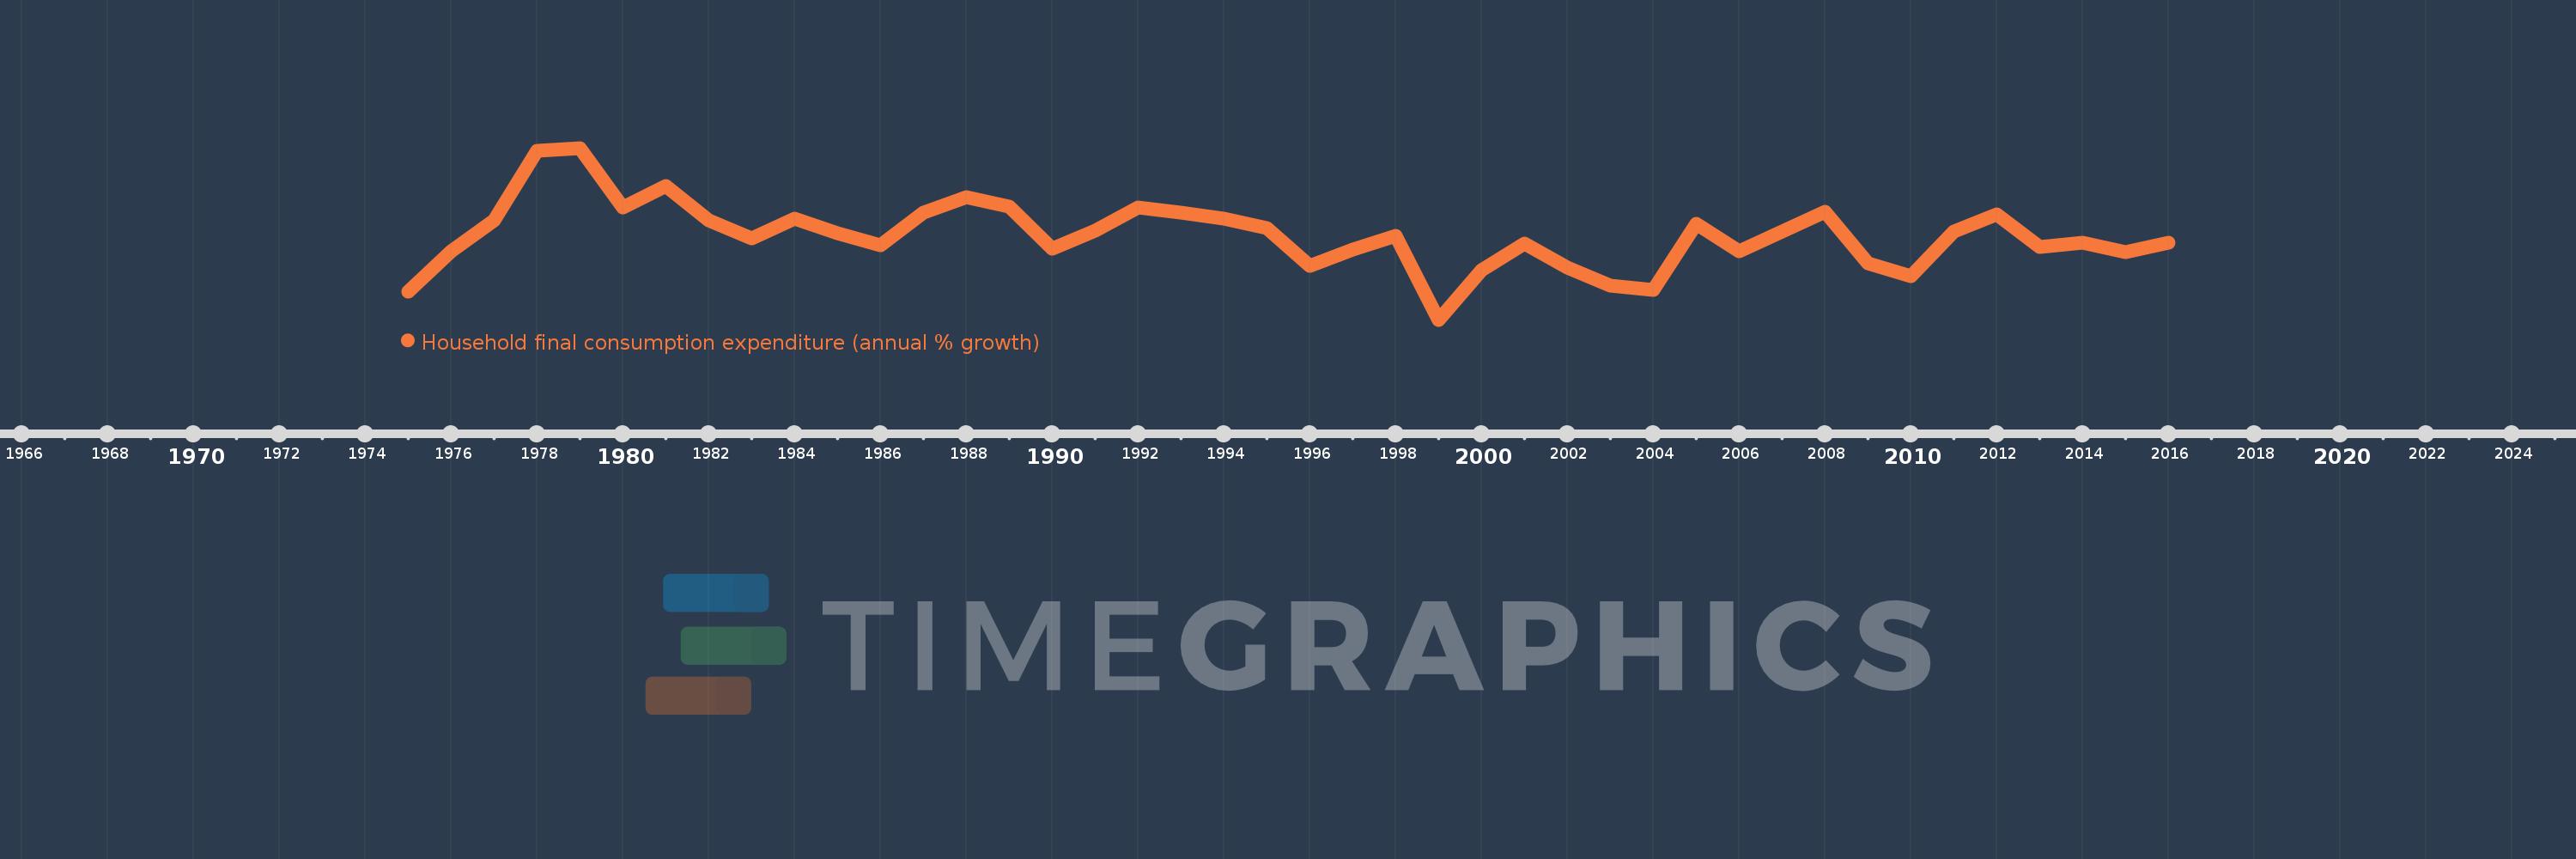
Household final consumption expenditure (annual % growth)
2016,2015,2014,2013,2012,2011,2010,2009,2008,2007,2006,2005,2004,2003,2002,2001,2000,1999,1998,1997,1996,1995,1994,1993,1992,1991,1990,1989,1988,1987,1986,1985,1984,1983,1982,1981,1980,1979,1978,1977,1976,1975
This statistics in other country:
AlbaniaAlgeriaAntigua and BarbudaArab WorldArgentinaArmeniaAustraliaAustriaAzerbaijanBahamas, TheBahrainBangladeshBarbadosBelarusBelgiumBelizeBeninBhutanBoliviaBosnia and HerzegovinaBotswanaBrazilBrunei DarussalamBulgariaBurkina FasoBurundiCabo VerdeCambodiaCameroonCanadaCaribbean small statesCentral Europe and the BalticsChadChileChinaColombiaComorosCongo, Dem. Rep.Congo, Rep.Costa RicaCote d'IvoireCroatiaCubaCyprusCzech RepublicDenmarkDominican RepublicEarly-demographic dividendEast Asia & PacificEast Asia & Pacific (excluding high income)East Asia & Pacific (IDA & IBRD countries)EcuadorEgypt, Arab Rep.El SalvadorEquatorial GuineaEritreaEstoniaEthiopiaEuro areaEurope & Central AsiaEurope & Central Asia (excluding high income)Europe & Central Asia (IDA & IBRD countries)European UnionFinlandFranceGabonGambia, TheGeorgiaGermanyGhanaGreeceGuatemalaGuineaGuinea-BissauHaitiHeavily indebted poor countries (HIPC)High incomeHondurasHong Kong SAR, ChinaHungaryIBRD onlyIcelandIDA & IBRD totalIDA blendIDA onlyIDA totalIndiaIndonesiaIran, Islamic Rep.IrelandIsraelItalyJamaicaJapanJordanKazakhstanKenyaKorea, Rep.KosovoKuwaitKyrgyz RepublicLao PDRLate-demographic dividendLatin America & Caribbean Latin America & Caribbean (excluding high income)Latin America & the Caribbean (IDA & IBRD countries)LatviaLeast developed countries: UN classificationLebanonLiberiaLithuaniaLow & middle incomeLow incomeLower middle incomeLuxembourgMacao SAR, ChinaMacedonia, FYRMadagascarMalawiMalaysiaMaliMaltaMauritaniaMauritiusMexicoMiddle East & North AfricaMiddle East & North Africa (excluding high income)Middle East & North Africa (IDA & IBRD countries)Middle incomeMoldovaMongoliaMontenegroMoroccoMozambiqueNamibiaNepalNetherlandsNew ZealandNicaraguaNigerNigeriaNorth AmericaNorwayOECD membersOmanOther small statesPakistanPanamaPapua New GuineaParaguayPeruPhilippinesPolandPortugalPost-demographic dividendPre-demographic dividendPuerto RicoQatarRomaniaRussian FederationRwandaSaudi ArabiaSenegalSerbiaSeychellesSierra LeoneSingaporeSlovak RepublicSloveniaSmall statesSomaliaSouth AfricaSouth AsiaSouth Asia (IDA & IBRD)South SudanSpainSri LankaSub-Saharan Africa Sub-Saharan Africa (excluding high income)Sub-Saharan Africa (IDA & IBRD countries)SudanSurinameSwazilandSwedenSwitzerlandSyrian Arab RepublicTajikistanTanzaniaThailandTimor-LesteTogoTrinidad and TobagoTunisiaTurkeyTurkmenistanUgandaUkraineUnited Arab EmiratesUnited KingdomUnited StatesUpper middle incomeUruguayVanuatuVenezuela, RBVietnamWest Bank and GazaWorldZimbabwe Timeline:
This timeline shows a graph from 1975 to 2016 of Hong Kong SAR, China. No data until 1974. Number of actual observations by date: 42.
Source name:
World Development Indicators
Source organization:
World Bank national accounts data, and OECD National Accounts data files.
Categories, topics:
Economy & Growth
Last updated:
apr 23, 2017
Indicators value changes by year
Minimum:
-5.496
jan 1, 1999
Maximum:
17.091
jan 1, 1979
At the date of observation
Value
Absolute change
Change from previous value
jan 1, 1975
-1.784
-1.784
0.0%
jan 1, 1976
3.52
+5.304
-297.3%
jan 1, 1977
7.54
+4.02
114.2%
jan 1, 1978
16.672
+9.132
121.12%
jan 1, 1979
17.091
+0.418
2.51%
jan 1, 1980
9.299
-7.792
-45.59%
jan 1, 1981
12.041
+2.742
29.49%
jan 1, 1982
7.581
-4.461
-37.04%
jan 1, 1983
5.224
-2.357
-31.09%
jan 1, 1984
7.807
+2.583
49.45%
jan 1, 1985
5.881
-1.926
-24.67%
jan 1, 1986
4.242
-1.639
-27.87%
jan 1, 1987
8.542
+4.3
101.36%
jan 1, 1988
10.654
+2.112
24.73%
jan 1, 1989
9.371
-1.284
-12.05%
jan 1, 1990
3.827
-5.543
-59.16%
jan 1, 1991
6.262
+2.435
63.62%
jan 1, 1992
9.258
+2.997
47.85%
jan 1, 1993
8.582
-0.676
-7.31%
jan 1, 1994
7.846
-0.736
-8.57%
jan 1, 1995
6.499
-1.348
-17.18%
jan 1, 1996
1.629
-4.869
-74.93%
jan 1, 1997
3.725
+2.096
128.63%
jan 1, 1998
5.54
+1.815
48.72%
jan 1, 1999
-5.496
-11.036
-199.22%
jan 1, 2000
1.045
+6.542
-119.02%
jan 1, 2001
4.516
+3.47
331.95%
jan 1, 2002
1.4
-3.115
-68.99%
jan 1, 2003
-1.046
-2.447
-174.71%
jan 1, 2004
-1.557
-0.511
48.83%
jan 1, 2005
7.127
+8.685
-557.67%
jan 1, 2006
3.544
-3.584
-50.28%
jan 1, 2007
6.096
+2.552
72.02%
jan 1, 2008
8.648
+2.553
41.87%
jan 1, 2009
1.899
-6.749
-78.04%
jan 1, 2010
0.179
-1.72
-90.56%
jan 1, 2011
6.114
+5.935
3.31K%
jan 1, 2012
8.393
+2.279
37.27%
jan 1, 2013
4.103
-4.29
-51.12%
jan 1, 2014
4.62
+0.517
12.61%
jan 1, 2015
3.341
-1.279
-27.69%
jan 1, 2016
4.668
+1.328
39.74%
Ranking of countries by current statistics by years


Comments: