29
/
en
AIzaSyAYiBZKx7MnpbEhh9jyipgxe19OcubqV5w
April 1, 2024
89898
Botswana
BWA
true
2
1
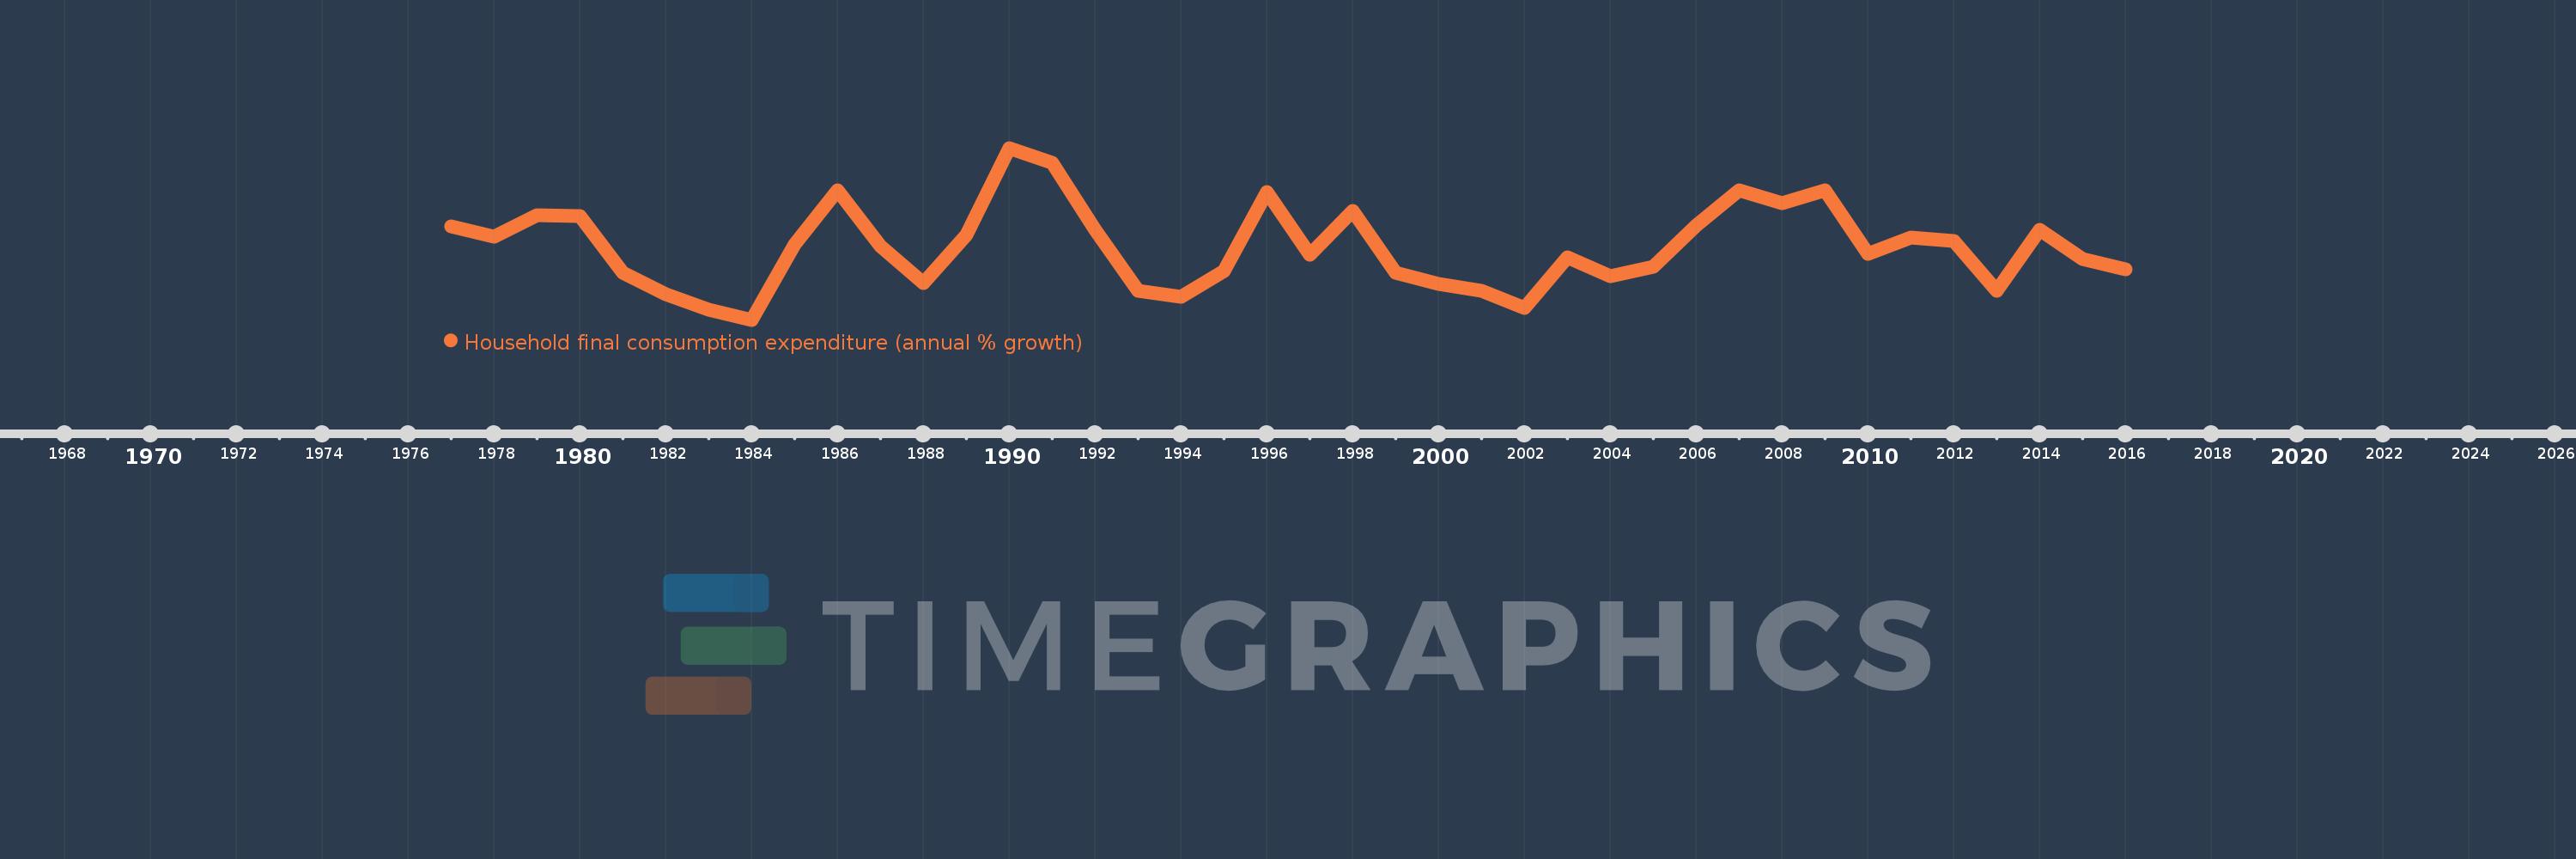
Household final consumption expenditure (annual % growth)
2016,2015,2014,2013,2012,2011,2010,2009,2008,2007,2006,2005,2004,2003,2002,2001,2000,1999,1998,1997,1996,1995,1994,1993,1992,1991,1990,1989,1988,1987,1986,1985,1984,1983,1982,1981,1980,1979,1978,1977
This statistics in other country:
AlbaniaAlgeriaAntigua and BarbudaArab WorldArgentinaArmeniaAustraliaAustriaAzerbaijanBahamas, TheBahrainBangladeshBarbadosBelarusBelgiumBelizeBeninBhutanBoliviaBosnia and HerzegovinaBotswanaBrazilBrunei DarussalamBulgariaBurkina FasoBurundiCabo VerdeCambodiaCameroonCanadaCaribbean small statesCentral Europe and the BalticsChadChileChinaColombiaComorosCongo, Dem. Rep.Congo, Rep.Costa RicaCote d'IvoireCroatiaCubaCyprusCzech RepublicDenmarkDominican RepublicEarly-demographic dividendEast Asia & PacificEast Asia & Pacific (excluding high income)East Asia & Pacific (IDA & IBRD countries)EcuadorEgypt, Arab Rep.El SalvadorEquatorial GuineaEritreaEstoniaEthiopiaEuro areaEurope & Central AsiaEurope & Central Asia (excluding high income)Europe & Central Asia (IDA & IBRD countries)European UnionFinlandFranceGabonGambia, TheGeorgiaGermanyGhanaGreeceGuatemalaGuineaGuinea-BissauHaitiHeavily indebted poor countries (HIPC)High incomeHondurasHong Kong SAR, ChinaHungaryIBRD onlyIcelandIDA & IBRD totalIDA blendIDA onlyIDA totalIndiaIndonesiaIran, Islamic Rep.IrelandIsraelItalyJamaicaJapanJordanKazakhstanKenyaKorea, Rep.KosovoKuwaitKyrgyz RepublicLao PDRLate-demographic dividendLatin America & Caribbean Latin America & Caribbean (excluding high income)Latin America & the Caribbean (IDA & IBRD countries)LatviaLeast developed countries: UN classificationLebanonLiberiaLithuaniaLow & middle incomeLow incomeLower middle incomeLuxembourgMacao SAR, ChinaMacedonia, FYRMadagascarMalawiMalaysiaMaliMaltaMauritaniaMauritiusMexicoMiddle East & North AfricaMiddle East & North Africa (excluding high income)Middle East & North Africa (IDA & IBRD countries)Middle incomeMoldovaMongoliaMontenegroMoroccoMozambiqueNamibiaNepalNetherlandsNew ZealandNicaraguaNigerNigeriaNorth AmericaNorwayOECD membersOmanOther small statesPakistanPanamaPapua New GuineaParaguayPeruPhilippinesPolandPortugalPost-demographic dividendPre-demographic dividendPuerto RicoQatarRomaniaRussian FederationRwandaSaudi ArabiaSenegalSerbiaSeychellesSierra LeoneSingaporeSlovak RepublicSloveniaSmall statesSomaliaSouth AfricaSouth AsiaSouth Asia (IDA & IBRD)South SudanSpainSri LankaSub-Saharan Africa Sub-Saharan Africa (excluding high income)Sub-Saharan Africa (IDA & IBRD countries)SudanSurinameSwazilandSwedenSwitzerlandSyrian Arab RepublicTajikistanTanzaniaThailandTimor-LesteTogoTrinidad and TobagoTunisiaTurkeyTurkmenistanUgandaUkraineUnited Arab EmiratesUnited KingdomUnited StatesUpper middle incomeUruguayVanuatuVenezuela, RBVietnamWest Bank and GazaWorldZimbabwe Timeline:
This timeline shows a graph from 1977 to 2016 of Botswana. No data until 1976. Number of actual observations by date: 40.
Source name:
World Development Indicators
Source organization:
World Bank national accounts data, and OECD National Accounts data files.
Categories, topics:
Economy & Growth
Last updated:
apr 23, 2017
Indicators value changes by year
Minimum:
-6.668
jan 1, 1984
Maximum:
25.158
jan 1, 1990
At the date of observation
Value
Absolute change
Change from previous value
jan 1, 1977
10.6
+10.6
0.0%
jan 1, 1978
8.781
-1.819
-17.16%
jan 1, 1979
12.724
+3.943
44.9%
jan 1, 1980
12.465
-0.259
-2.04%
jan 1, 1981
1.97
-10.495
-84.2%
jan 1, 1982
-1.898
-3.868
-196.39%
jan 1, 1983
-4.796
-2.897
152.62%
jan 1, 1984
-6.668
-1.872
39.04%
jan 1, 1985
7.284
+13.952
-209.23%
jan 1, 1986
17.244
+9.96
136.73%
jan 1, 1987
6.926
-10.318
-59.83%
jan 1, 1988
0.193
-6.733
-97.21%
jan 1, 1989
8.976
+8.783
4.55K%
jan 1, 1990
25.158
+16.182
180.29%
jan 1, 1991
22.398
-2.761
-10.97%
jan 1, 1992
9.964
-12.434
-55.51%
jan 1, 1993
-1.282
-11.246
-112.87%
jan 1, 1994
-2.35
-1.068
83.29%
jan 1, 1995
2.352
+4.702
-200.07%
jan 1, 1996
16.941
+14.589
620.35%
jan 1, 1997
5.427
-11.514
-67.97%
jan 1, 1998
13.451
+8.024
147.87%
jan 1, 1999
2.087
-11.364
-84.49%
jan 1, 2000
0.039
-2.047
-98.12%
jan 1, 2001
-1.3
-1.339
-3.41K%
jan 1, 2002
-4.462
-3.163
243.36%
jan 1, 2003
4.953
+9.416
-211.0%
jan 1, 2004
1.332
-3.621
-73.11%
jan 1, 2005
3.076
+1.744
130.92%
jan 1, 2006
10.775
+7.7
250.33%
jan 1, 2007
17.248
+6.473
60.07%
jan 1, 2008
14.994
-2.255
-13.07%
jan 1, 2009
17.259
+2.265
15.11%
jan 1, 2010
5.533
-11.726
-67.94%
jan 1, 2011
8.619
+3.086
55.78%
jan 1, 2012
7.877
-0.742
-8.61%
jan 1, 2013
-1.355
-9.232
-117.2%
jan 1, 2014
10.006
+11.361
-838.62%
jan 1, 2015
4.55
-5.456
-54.53%
jan 1, 2016
2.635
-1.915
-42.09%
Ranking of countries by current statistics by years


Comments: