29
/
en
AIzaSyAYiBZKx7MnpbEhh9jyipgxe19OcubqV5w
April 1, 2024
115877
Cuba
CUB
true
2
1
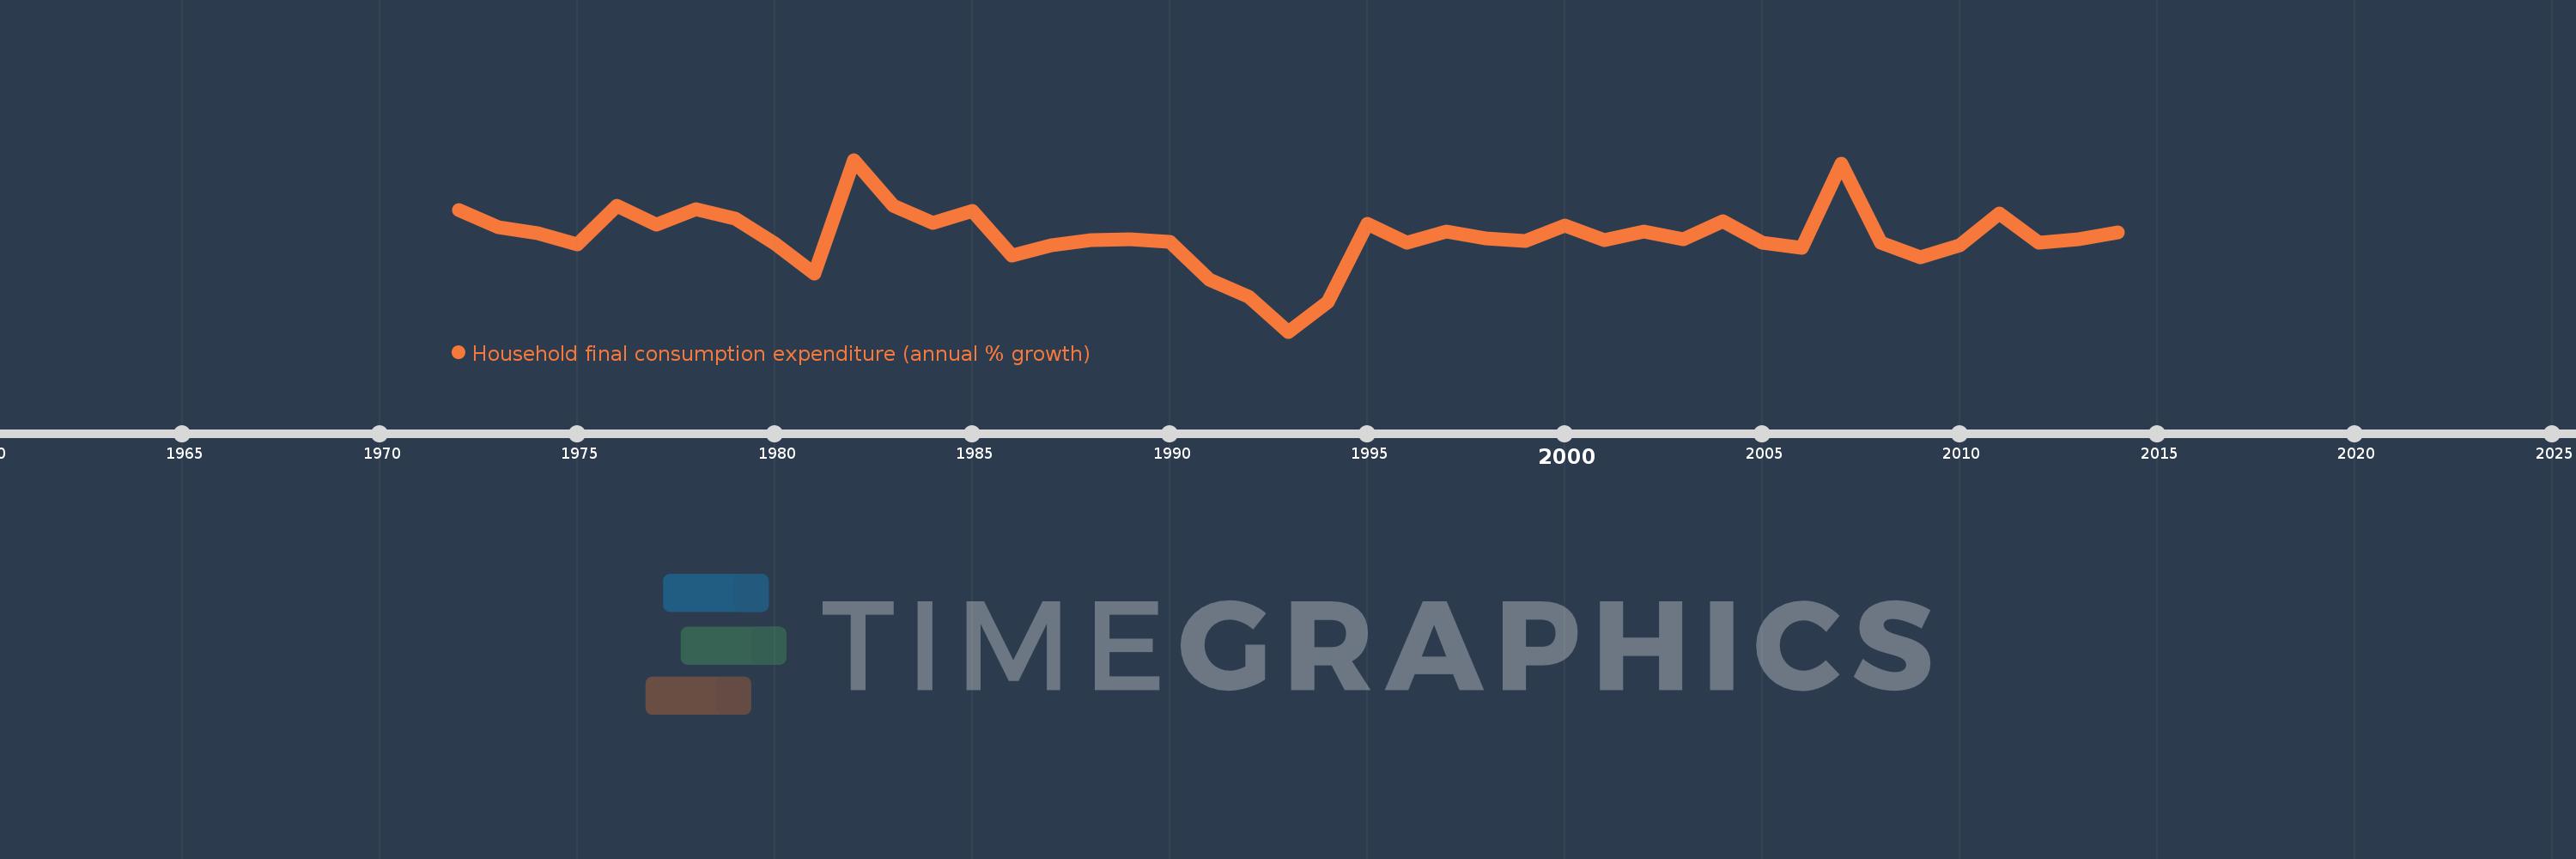
Household final consumption expenditure (annual % growth)
2014,2013,2012,2011,2010,2009,2008,2007,2006,2005,2004,2003,2002,2001,2000,1999,1998,1997,1996,1995,1994,1993,1992,1991,1990,1989,1988,1987,1986,1985,1984,1983,1982,1981,1980,1979,1978,1977,1976,1975,1974,1973,1972
This statistics in other country:
AlbaniaAlgeriaAntigua and BarbudaArab WorldArgentinaArmeniaAustraliaAustriaAzerbaijanBahamas, TheBahrainBangladeshBarbadosBelarusBelgiumBelizeBeninBhutanBoliviaBosnia and HerzegovinaBotswanaBrazilBrunei DarussalamBulgariaBurkina FasoBurundiCabo VerdeCambodiaCameroonCanadaCaribbean small statesCentral Europe and the BalticsChadChileChinaColombiaComorosCongo, Dem. Rep.Congo, Rep.Costa RicaCote d'IvoireCroatiaCubaCyprusCzech RepublicDenmarkDominican RepublicEarly-demographic dividendEast Asia & PacificEast Asia & Pacific (excluding high income)East Asia & Pacific (IDA & IBRD countries)EcuadorEgypt, Arab Rep.El SalvadorEquatorial GuineaEritreaEstoniaEthiopiaEuro areaEurope & Central AsiaEurope & Central Asia (excluding high income)Europe & Central Asia (IDA & IBRD countries)European UnionFinlandFranceGabonGambia, TheGeorgiaGermanyGhanaGreeceGuatemalaGuineaGuinea-BissauHaitiHeavily indebted poor countries (HIPC)High incomeHondurasHong Kong SAR, ChinaHungaryIBRD onlyIcelandIDA & IBRD totalIDA blendIDA onlyIDA totalIndiaIndonesiaIran, Islamic Rep.IrelandIsraelItalyJamaicaJapanJordanKazakhstanKenyaKorea, Rep.KosovoKuwaitKyrgyz RepublicLao PDRLate-demographic dividendLatin America & Caribbean Latin America & Caribbean (excluding high income)Latin America & the Caribbean (IDA & IBRD countries)LatviaLeast developed countries: UN classificationLebanonLiberiaLithuaniaLow & middle incomeLow incomeLower middle incomeLuxembourgMacao SAR, ChinaMacedonia, FYRMadagascarMalawiMalaysiaMaliMaltaMauritaniaMauritiusMexicoMiddle East & North AfricaMiddle East & North Africa (excluding high income)Middle East & North Africa (IDA & IBRD countries)Middle incomeMoldovaMongoliaMontenegroMoroccoMozambiqueNamibiaNepalNetherlandsNew ZealandNicaraguaNigerNigeriaNorth AmericaNorwayOECD membersOmanOther small statesPakistanPanamaPapua New GuineaParaguayPeruPhilippinesPolandPortugalPost-demographic dividendPre-demographic dividendPuerto RicoQatarRomaniaRussian FederationRwandaSaudi ArabiaSenegalSerbiaSeychellesSierra LeoneSingaporeSlovak RepublicSloveniaSmall statesSomaliaSouth AfricaSouth AsiaSouth Asia (IDA & IBRD)South SudanSpainSri LankaSub-Saharan Africa Sub-Saharan Africa (excluding high income)Sub-Saharan Africa (IDA & IBRD countries)SudanSurinameSwazilandSwedenSwitzerlandSyrian Arab RepublicTajikistanTanzaniaThailandTimor-LesteTogoTrinidad and TobagoTunisiaTurkeyTurkmenistanUgandaUkraineUnited Arab EmiratesUnited KingdomUnited StatesUpper middle incomeUruguayVanuatuVenezuela, RBVietnamWest Bank and GazaWorldZimbabwe Timeline:
This timeline shows a graph from 1972 to 2014 of Cuba. No data until 1971. Number of actual observations by date: 43.
Source name:
World Development Indicators
Source organization:
World Bank national accounts data, and OECD National Accounts data files.
Categories, topics:
Economy & Growth
Last updated:
apr 23, 2017
Indicators value changes by year
Minimum:
-17.847
jan 1, 1993
Maximum:
19.476
jan 1, 1982
At the date of observation
Value
Absolute change
Change from previous value
jan 1, 1972
8.572
+8.572
0.0%
jan 1, 1973
4.825
-3.747
-43.71%
jan 1, 1974
3.447
-1.378
-28.56%
jan 1, 1975
1.016
-2.431
-70.52%
jan 1, 1976
9.435
+8.419
828.35%
jan 1, 1977
5.364
-4.071
-43.15%
jan 1, 1978
8.76
+3.397
63.32%
jan 1, 1979
6.683
-2.078
-23.72%
jan 1, 1980
1.218
-5.465
-81.78%
jan 1, 1981
-5.213
-6.431
-528.19%
jan 1, 1982
19.476
+24.689
-473.58%
jan 1, 1983
9.558
-9.918
-50.92%
jan 1, 1984
5.677
-3.881
-40.6%
jan 1, 1985
8.319
+2.641
46.52%
jan 1, 1986
-1.365
-9.684
-116.41%
jan 1, 1987
0.969
+2.334
-170.98%
jan 1, 1988
1.943
+0.974
100.53%
jan 1, 1989
2.289
+0.346
17.83%
jan 1, 1990
1.579
-0.71
-31.02%
jan 1, 1991
-6.584
-8.163
-516.94%
jan 1, 1992
-10.239
-3.656
55.53%
jan 1, 1993
-17.847
-7.608
74.31%
jan 1, 1994
-11.323
+6.524
-36.55%
jan 1, 1995
5.664
+16.988
-150.02%
jan 1, 1996
1.471
-4.193
-74.03%
jan 1, 1997
3.92
+2.449
166.52%
jan 1, 1998
2.31
-1.611
-41.08%
jan 1, 1999
1.877
-0.433
-18.73%
jan 1, 2000
5.116
+3.239
172.55%
jan 1, 2001
2.09
-3.026
-59.16%
jan 1, 2002
3.822
+1.733
82.92%
jan 1, 2003
2.132
-1.69
-44.23%
jan 1, 2004
6.2
+4.069
190.87%
jan 1, 2005
1.54
-4.66
-75.16%
jan 1, 2006
0.378
-1.162
-75.44%
jan 1, 2007
18.71
+18.332
4.85K%
jan 1, 2008
1.519
-17.192
-91.88%
jan 1, 2009
-1.767
-3.286
-216.37%
jan 1, 2010
0.888
+2.655
-150.25%
jan 1, 2011
7.864
+6.976
785.58%
jan 1, 2012
1.4
-6.464
-82.19%
jan 1, 2013
2.197
+0.797
56.92%
jan 1, 2014
3.711
+1.514
68.88%
Ranking of countries by current statistics by years


Comments: