29
/
en
AIzaSyAYiBZKx7MnpbEhh9jyipgxe19OcubqV5w
April 1, 2024
262339
Thailand
THA
true
2
1
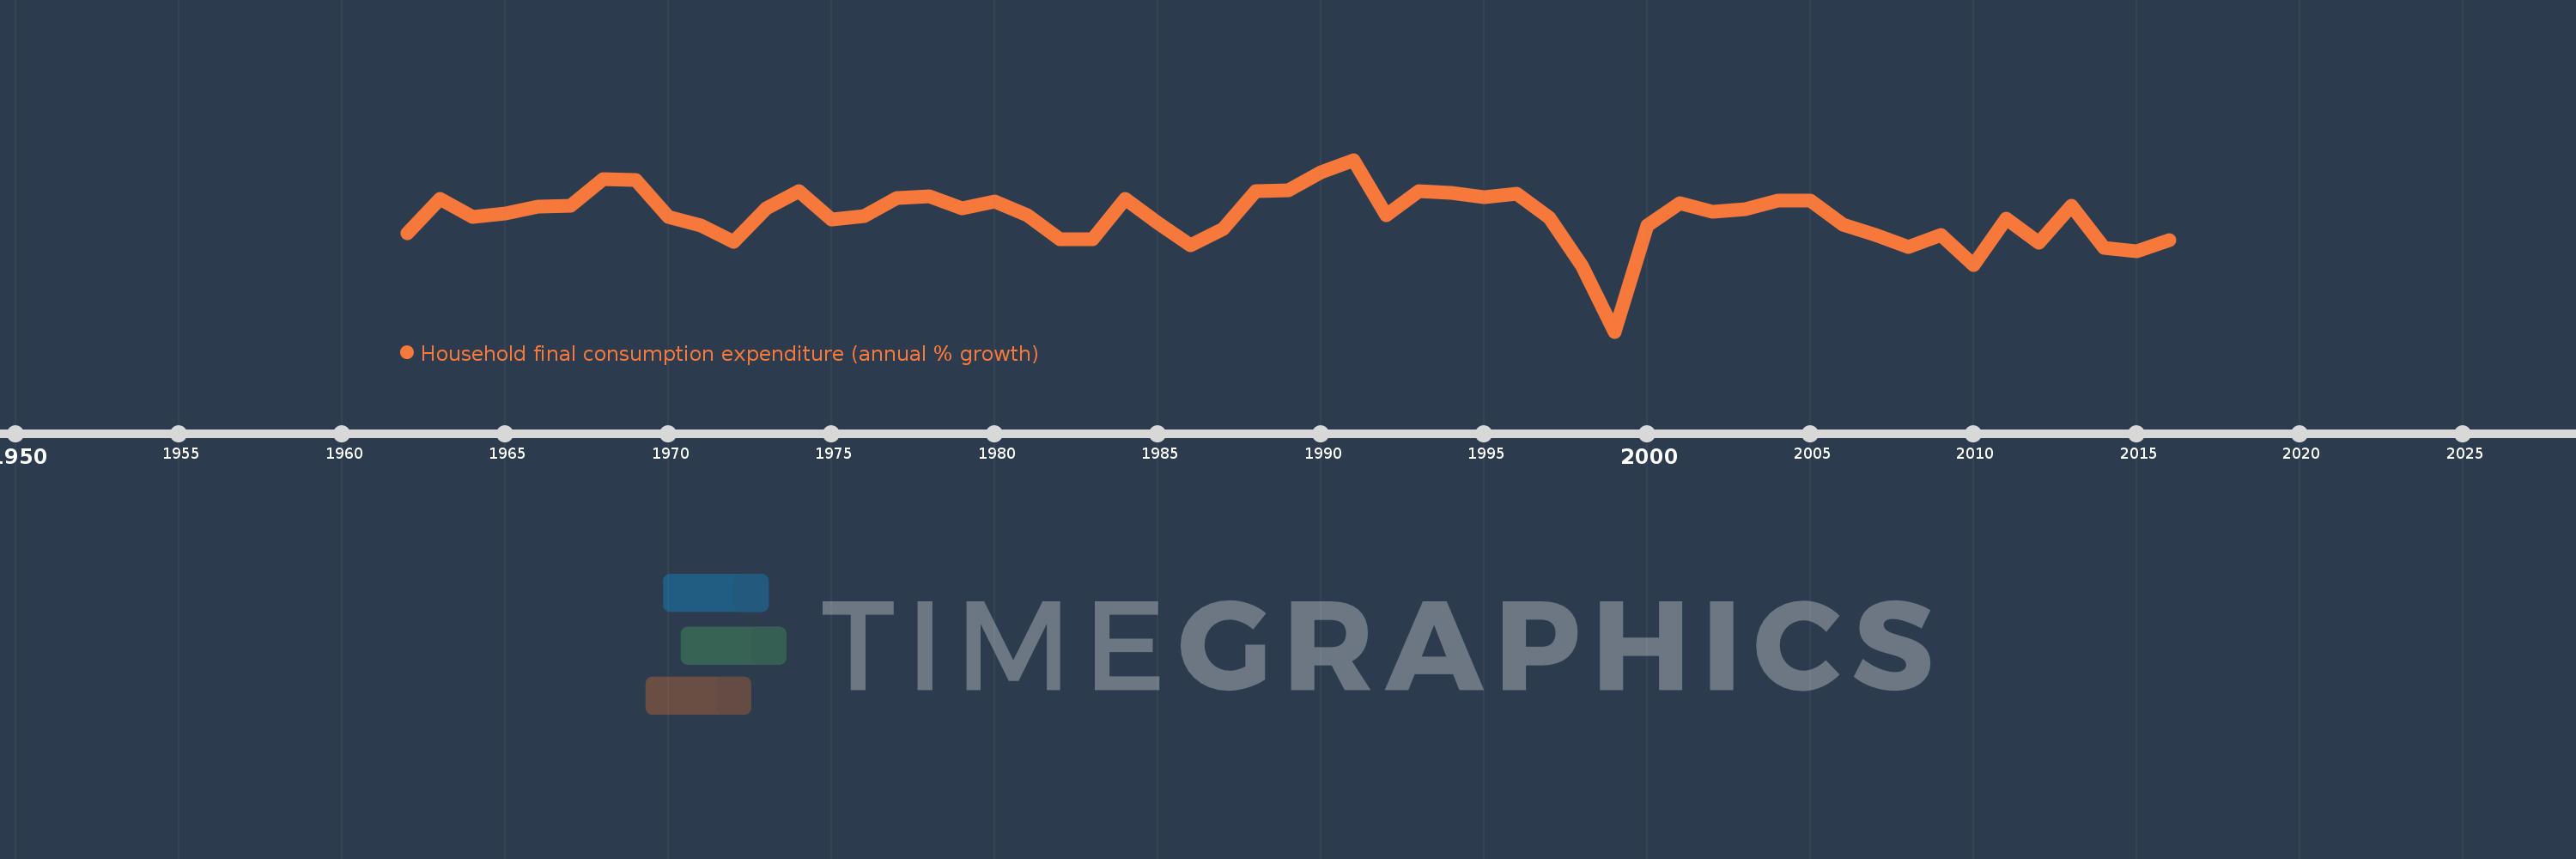
Household final consumption expenditure (annual % growth)
2016,2015,2014,2013,2012,2011,2010,2009,2008,2007,2006,2005,2004,2003,2002,2001,2000,1999,1998,1997,1996,1995,1994,1993,1992,1991,1990,1989,1988,1987,1986,1985,1984,1983,1982,1981,1980,1979,1978,1977,1976,1975,1974,1973,1972,1971,1970,1969,1968,1967,1966,1965,1964,1963,1962
This statistics in other country:
AlbaniaAlgeriaAntigua and BarbudaArab WorldArgentinaArmeniaAustraliaAustriaAzerbaijanBahamas, TheBahrainBangladeshBarbadosBelarusBelgiumBelizeBeninBhutanBoliviaBosnia and HerzegovinaBotswanaBrazilBrunei DarussalamBulgariaBurkina FasoBurundiCabo VerdeCambodiaCameroonCanadaCaribbean small statesCentral Europe and the BalticsChadChileChinaColombiaComorosCongo, Dem. Rep.Congo, Rep.Costa RicaCote d'IvoireCroatiaCubaCyprusCzech RepublicDenmarkDominican RepublicEarly-demographic dividendEast Asia & PacificEast Asia & Pacific (excluding high income)East Asia & Pacific (IDA & IBRD countries)EcuadorEgypt, Arab Rep.El SalvadorEquatorial GuineaEritreaEstoniaEthiopiaEuro areaEurope & Central AsiaEurope & Central Asia (excluding high income)Europe & Central Asia (IDA & IBRD countries)European UnionFinlandFranceGabonGambia, TheGeorgiaGermanyGhanaGreeceGuatemalaGuineaGuinea-BissauHaitiHeavily indebted poor countries (HIPC)High incomeHondurasHong Kong SAR, ChinaHungaryIBRD onlyIcelandIDA & IBRD totalIDA blendIDA onlyIDA totalIndiaIndonesiaIran, Islamic Rep.IrelandIsraelItalyJamaicaJapanJordanKazakhstanKenyaKorea, Rep.KosovoKuwaitKyrgyz RepublicLao PDRLate-demographic dividendLatin America & Caribbean Latin America & Caribbean (excluding high income)Latin America & the Caribbean (IDA & IBRD countries)LatviaLeast developed countries: UN classificationLebanonLiberiaLithuaniaLow & middle incomeLow incomeLower middle incomeLuxembourgMacao SAR, ChinaMacedonia, FYRMadagascarMalawiMalaysiaMaliMaltaMauritaniaMauritiusMexicoMiddle East & North AfricaMiddle East & North Africa (excluding high income)Middle East & North Africa (IDA & IBRD countries)Middle incomeMoldovaMongoliaMontenegroMoroccoMozambiqueNamibiaNepalNetherlandsNew ZealandNicaraguaNigerNigeriaNorth AmericaNorwayOECD membersOmanOther small statesPakistanPanamaPapua New GuineaParaguayPeruPhilippinesPolandPortugalPost-demographic dividendPre-demographic dividendPuerto RicoQatarRomaniaRussian FederationRwandaSaudi ArabiaSenegalSerbiaSeychellesSierra LeoneSingaporeSlovak RepublicSloveniaSmall statesSomaliaSouth AfricaSouth AsiaSouth Asia (IDA & IBRD)South SudanSpainSri LankaSub-Saharan Africa Sub-Saharan Africa (excluding high income)Sub-Saharan Africa (IDA & IBRD countries)SudanSurinameSwazilandSwedenSwitzerlandSyrian Arab RepublicTajikistanTanzaniaThailandTimor-LesteTogoTrinidad and TobagoTunisiaTurkeyTurkmenistanUgandaUkraineUnited Arab EmiratesUnited KingdomUnited StatesUpper middle incomeUruguayVanuatuVenezuela, RBVietnamWest Bank and GazaWorldZimbabwe Timeline:
This timeline shows a graph from 1962 to 2016 of Thailand. No data until 1961. Number of actual observations by date: 55.
Source name:
World Development Indicators
Source organization:
World Bank national accounts data, and OECD National Accounts data files.
Categories, topics:
Economy & Growth
Last updated:
apr 23, 2017
Indicators value changes by year
Maximum:
12.879
jan 1, 1991
At the date of observation
Value
Absolute change
Change from previous value
jan 1, 1962
3.047
+3.047
0.0%
jan 1, 1963
7.579
+4.531
148.69%
jan 1, 1964
5.155
-2.424
-31.98%
jan 1, 1965
5.719
+0.564
10.95%
jan 1, 1966
6.647
+0.928
16.23%
jan 1, 1967
6.667
+0.02
0.3%
jan 1, 1968
10.326
+3.659
54.88%
jan 1, 1969
10.222
-0.104
-1.01%
jan 1, 1970
5.251
-4.971
-48.63%
jan 1, 1971
4.016
-1.235
-23.52%
jan 1, 1972
1.842
-2.174
-54.14%
jan 1, 1973
6.329
+4.487
243.66%
jan 1, 1974
8.674
+2.344
37.04%
jan 1, 1975
4.851
-3.822
-44.07%
jan 1, 1976
5.373
+0.522
10.75%
jan 1, 1977
7.79
+2.417
44.99%
jan 1, 1978
7.95
+0.16
2.05%
jan 1, 1979
6.33
-1.62
-20.38%
jan 1, 1980
7.327
+0.997
15.75%
jan 1, 1981
5.44
-1.887
-25.75%
jan 1, 1982
2.194
-3.246
-59.67%
jan 1, 1983
2.249
+0.055
2.52%
jan 1, 1984
7.59
+5.341
237.46%
jan 1, 1985
4.439
-3.152
-41.52%
jan 1, 1986
1.435
-3.004
-67.68%
jan 1, 1987
3.553
+2.119
147.69%
jan 1, 1988
8.664
+5.111
143.84%
jan 1, 1989
8.752
+0.088
1.02%
jan 1, 1990
11.206
+2.454
28.04%
jan 1, 1991
12.879
+1.673
14.93%
jan 1, 1992
5.421
-7.457
-57.9%
jan 1, 1993
8.698
+3.276
60.43%
jan 1, 1994
8.419
-0.279
-3.21%
jan 1, 1995
7.876
-0.543
-6.45%
jan 1, 1996
8.279
+0.403
5.12%
jan 1, 1997
5.033
-3.246
-39.2%
jan 1, 1998
-1.41
-6.444
-128.02%
jan 1, 1999
-10.2
-8.789
623.29%
jan 1, 2000
4.066
+14.266
-139.86%
jan 1, 2001
7.037
+2.971
73.08%
jan 1, 2002
5.896
-1.142
-16.22%
jan 1, 2003
6.222
+0.326
5.54%
jan 1, 2004
7.346
+1.124
18.07%
jan 1, 2005
7.428
+0.082
1.12%
jan 1, 2006
4.201
-3.227
-43.45%
jan 1, 2007
2.801
-1.4
-33.33%
jan 1, 2008
1.192
-1.609
-57.46%
jan 1, 2009
2.833
+1.642
137.78%
jan 1, 2010
-1.255
-4.088
-144.28%
jan 1, 2011
5.0
+6.254
-498.51%
jan 1, 2012
1.766
-3.234
-64.69%
jan 1, 2013
6.683
+4.917
278.49%
jan 1, 2014
1.047
-5.636
-84.33%
jan 1, 2015
0.552
-0.495
-47.3%
jan 1, 2016
2.134
+1.582
286.74%
Ranking of countries by current statistics by years


Comments: