29
/
en
AIzaSyAYiBZKx7MnpbEhh9jyipgxe19OcubqV5w
April 1, 2024
190330
Mali
MLI
true
2
1
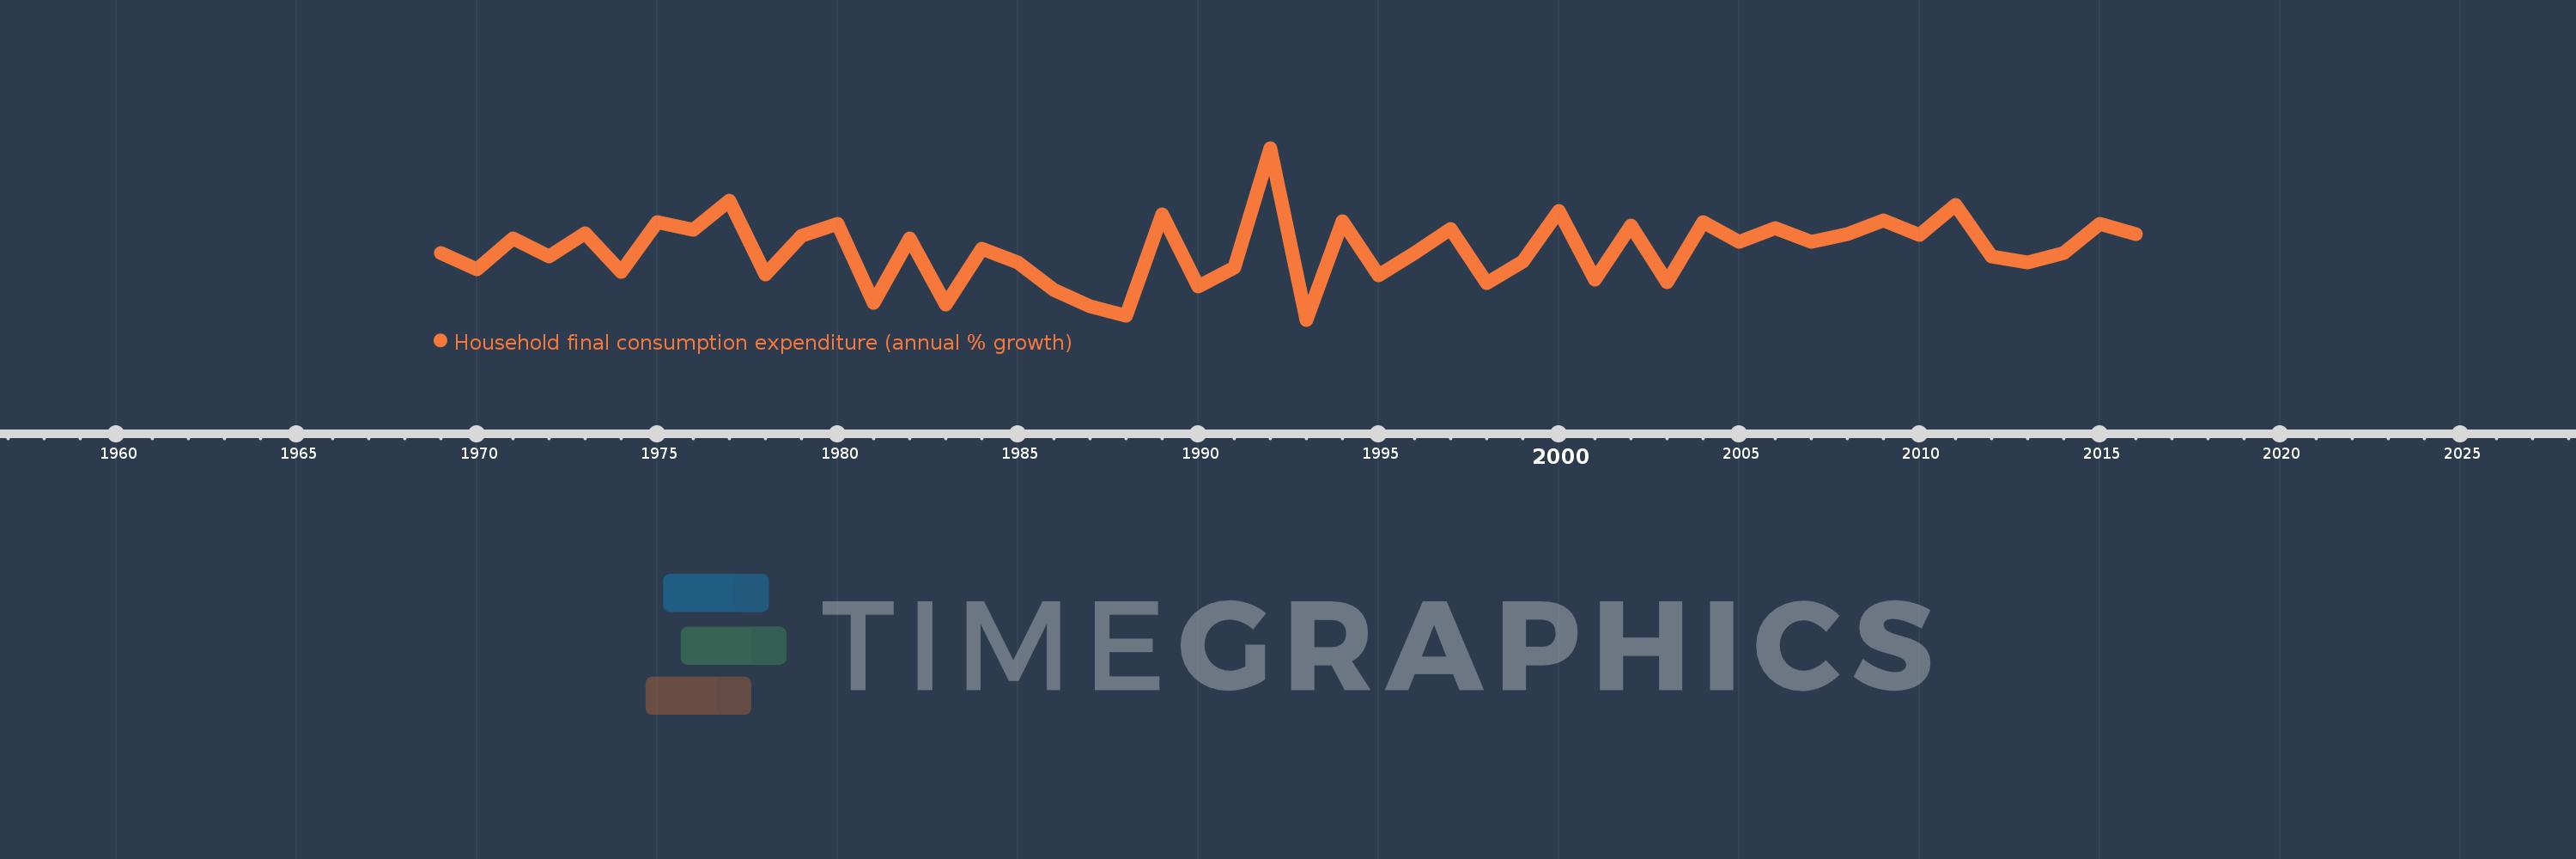
Household final consumption expenditure (annual % growth)
2016,2015,2014,2013,2012,2011,2010,2009,2008,2007,2006,2005,2004,2003,2002,2001,2000,1999,1998,1997,1996,1995,1994,1993,1992,1991,1990,1989,1988,1987,1986,1985,1984,1983,1982,1981,1980,1979,1978,1977,1976,1975,1974,1973,1972,1971,1970,1969
This statistics in other country:
AlbaniaAlgeriaAntigua and BarbudaArab WorldArgentinaArmeniaAustraliaAustriaAzerbaijanBahamas, TheBahrainBangladeshBarbadosBelarusBelgiumBelizeBeninBhutanBoliviaBosnia and HerzegovinaBotswanaBrazilBrunei DarussalamBulgariaBurkina FasoBurundiCabo VerdeCambodiaCameroonCanadaCaribbean small statesCentral Europe and the BalticsChadChileChinaColombiaComorosCongo, Dem. Rep.Congo, Rep.Costa RicaCote d'IvoireCroatiaCubaCyprusCzech RepublicDenmarkDominican RepublicEarly-demographic dividendEast Asia & PacificEast Asia & Pacific (excluding high income)East Asia & Pacific (IDA & IBRD countries)EcuadorEgypt, Arab Rep.El SalvadorEquatorial GuineaEritreaEstoniaEthiopiaEuro areaEurope & Central AsiaEurope & Central Asia (excluding high income)Europe & Central Asia (IDA & IBRD countries)European UnionFinlandFranceGabonGambia, TheGeorgiaGermanyGhanaGreeceGuatemalaGuineaGuinea-BissauHaitiHeavily indebted poor countries (HIPC)High incomeHondurasHong Kong SAR, ChinaHungaryIBRD onlyIcelandIDA & IBRD totalIDA blendIDA onlyIDA totalIndiaIndonesiaIran, Islamic Rep.IrelandIsraelItalyJamaicaJapanJordanKazakhstanKenyaKorea, Rep.KosovoKuwaitKyrgyz RepublicLao PDRLate-demographic dividendLatin America & Caribbean Latin America & Caribbean (excluding high income)Latin America & the Caribbean (IDA & IBRD countries)LatviaLeast developed countries: UN classificationLebanonLiberiaLithuaniaLow & middle incomeLow incomeLower middle incomeLuxembourgMacao SAR, ChinaMacedonia, FYRMadagascarMalawiMalaysiaMaliMaltaMauritaniaMauritiusMexicoMiddle East & North AfricaMiddle East & North Africa (excluding high income)Middle East & North Africa (IDA & IBRD countries)Middle incomeMoldovaMongoliaMontenegroMoroccoMozambiqueNamibiaNepalNetherlandsNew ZealandNicaraguaNigerNigeriaNorth AmericaNorwayOECD membersOmanOther small statesPakistanPanamaPapua New GuineaParaguayPeruPhilippinesPolandPortugalPost-demographic dividendPre-demographic dividendPuerto RicoQatarRomaniaRussian FederationRwandaSaudi ArabiaSenegalSerbiaSeychellesSierra LeoneSingaporeSlovak RepublicSloveniaSmall statesSomaliaSouth AfricaSouth AsiaSouth Asia (IDA & IBRD)South SudanSpainSri LankaSub-Saharan Africa Sub-Saharan Africa (excluding high income)Sub-Saharan Africa (IDA & IBRD countries)SudanSurinameSwazilandSwedenSwitzerlandSyrian Arab RepublicTajikistanTanzaniaThailandTimor-LesteTogoTrinidad and TobagoTunisiaTurkeyTurkmenistanUgandaUkraineUnited Arab EmiratesUnited KingdomUnited StatesUpper middle incomeUruguayVanuatuVenezuela, RBVietnamWest Bank and GazaWorldZimbabwe Timeline:
This timeline shows a graph from 1969 to 2016 of Mali. No data until 1968. Number of actual observations by date: 48.
Source name:
World Development Indicators
Source organization:
World Bank national accounts data, and OECD National Accounts data files.
Categories, topics:
Economy & Growth
Last updated:
apr 23, 2017
Indicators value changes by year
Minimum:
-8.233
jan 1, 1993
Maximum:
19.909
jan 1, 1992
At the date of observation
Value
Absolute change
Change from previous value
jan 1, 1969
2.701
+2.701
0.0%
jan 1, 1970
-0.033
-2.733
-101.21%
jan 1, 1971
5.101
+5.134
-15.75K%
jan 1, 1972
2.181
-2.92
-57.25%
jan 1, 1973
5.956
+3.775
173.12%
jan 1, 1974
-0.395
-6.351
-106.63%
jan 1, 1975
7.73
+8.125
-2.06K%
jan 1, 1976
6.551
-1.179
-15.25%
jan 1, 1977
11.216
+4.665
71.21%
jan 1, 1978
-0.779
-11.994
-106.94%
jan 1, 1979
5.478
+6.257
-803.64%
jan 1, 1980
7.512
+2.034
37.12%
jan 1, 1981
-5.527
-13.039
-173.58%
jan 1, 1982
5.059
+10.587
-191.54%
jan 1, 1983
-5.741
-10.8
-213.47%
jan 1, 1984
3.376
+9.117
-158.81%
jan 1, 1985
1.217
-2.159
-63.96%
jan 1, 1986
-3.339
-4.555
-374.43%
jan 1, 1987
-6.028
-2.689
80.53%
jan 1, 1988
-7.551
-1.524
25.28%
jan 1, 1989
9.098
+16.649
-220.48%
jan 1, 1990
-2.817
-11.914
-130.96%
jan 1, 1991
0.252
+3.069
-108.94%
jan 1, 1992
19.909
+19.657
7.8K%
jan 1, 1993
-8.233
-28.143
-141.35%
jan 1, 1994
7.86
+16.093
-195.46%
jan 1, 1995
-0.936
-8.795
-111.9%
jan 1, 1996
2.664
+3.599
-384.71%
jan 1, 1997
6.656
+3.992
149.89%
jan 1, 1998
-2.281
-8.936
-134.26%
jan 1, 1999
1.269
+3.549
-155.63%
jan 1, 2000
9.629
+8.361
658.97%
jan 1, 2001
-1.7
-11.33
-117.66%
jan 1, 2002
7.206
+8.906
-523.75%
jan 1, 2003
-2.128
-9.334
-129.53%
jan 1, 2004
7.816
+9.943
-467.29%
jan 1, 2005
4.495
-3.321
-42.49%
jan 1, 2006
6.767
+2.273
50.56%
jan 1, 2007
4.568
-2.199
-32.49%
jan 1, 2008
5.858
+1.29
28.24%
jan 1, 2009
8.024
+2.166
36.97%
jan 1, 2010
5.702
-2.322
-28.94%
jan 1, 2011
10.613
+4.911
86.11%
jan 1, 2012
2.2
-8.413
-79.27%
jan 1, 2013
1.182
-1.018
-46.29%
jan 1, 2014
2.647
+1.465
123.98%
jan 1, 2015
7.537
+4.89
184.78%
jan 1, 2016
5.836
-1.701
-22.57%
Ranking of countries by current statistics by years


Comments: