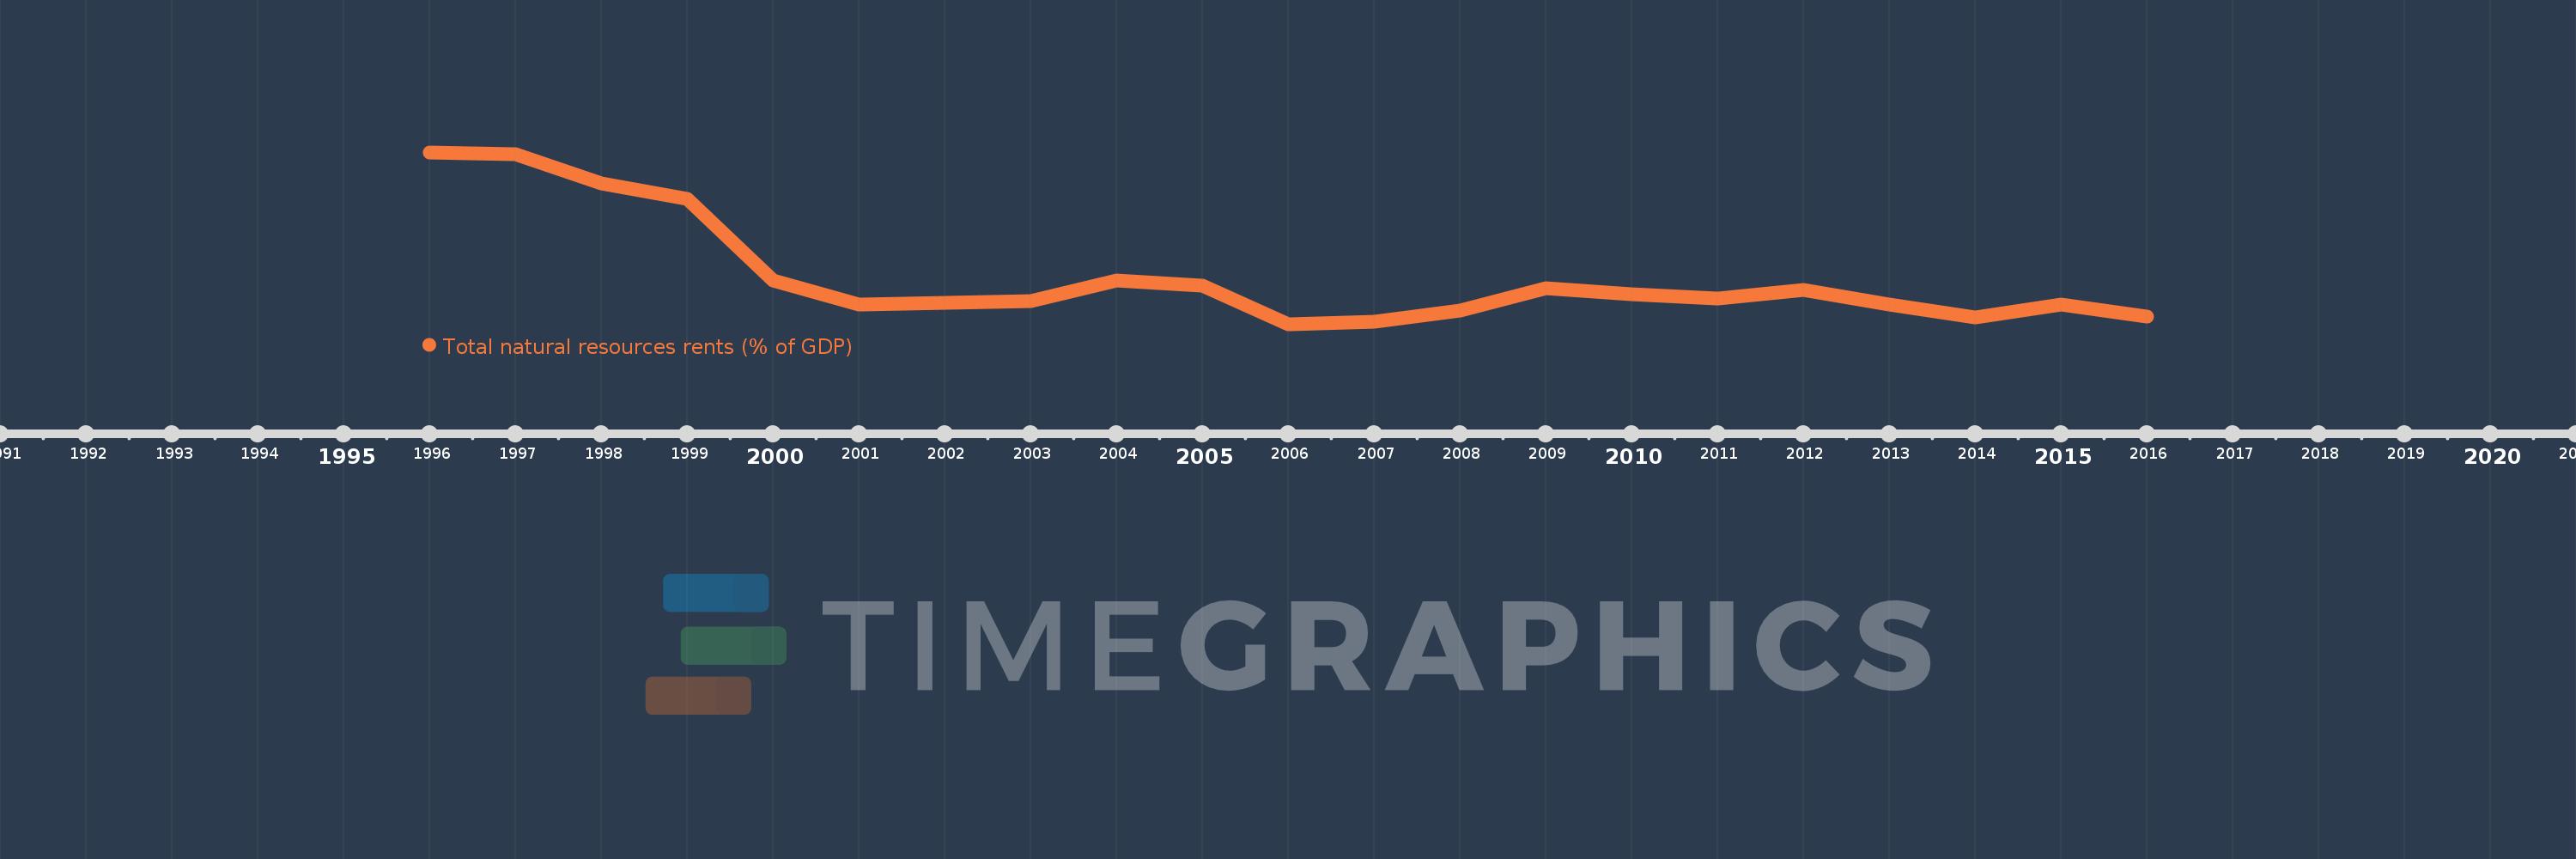
This timeline shows a graph from 1996 to 2016 of Cambodia. No data until 1995. Number of actual observations by date: 21.
Source name:
World Development Indicators
Source organization:
Estimates based on sources and methods described in "The Changing Wealth of Nations: Measuring Sustainable Development in the New Millennium" (World Bank, 2011).
Categories, topics:
Energy & Mining, Environment
Last updated:
apr 23, 2017
Indicators value changes by year
Meaning:
3.539
Minimum:
1.72
jan 1, 2006
Maximum:
8.327
jan 1, 1996
At the date of observation
Value
Absolute change
Change from the previous value
jan 1, 1996
8.327
+8.327
0.0%
jan 1, 1997
8.266
-0.061
-0.73%
jan 1, 1998
7.128
-1.138
-13.77%
jan 1, 1999
6.556
-0.572
-8.03%
jan 1, 2000
3.394
-3.163
-48.24%
jan 1, 2001
2.469
-0.925
-27.24%
jan 1, 2002
2.534
+0.065
2.61%
jan 1, 2003
2.595
+0.061
2.42%
jan 1, 2004
3.411
+0.815
31.43%
jan 1, 2005
3.204
-0.207
-6.06%
jan 1, 2006
1.72
-1.484
-46.32%
jan 1, 2007
1.822
+0.102
5.94%
jan 1, 2008
2.245
+0.423
23.24%
jan 1, 2009
3.1
+0.854
38.05%
jan 1, 2010
2.863
-0.237
-7.65%
jan 1, 2011
2.696
-0.167
-5.83%
jan 1, 2012
3.051
+0.355
13.15%
jan 1, 2013
2.463
-0.587
-19.25%
jan 1, 2014
1.965
-0.498
-20.21%
jan 1, 2015
2.481
+0.515
26.22%
jan 1, 2016
2.029
-0.452
-18.22%
Ranking of countries by current statistics by years