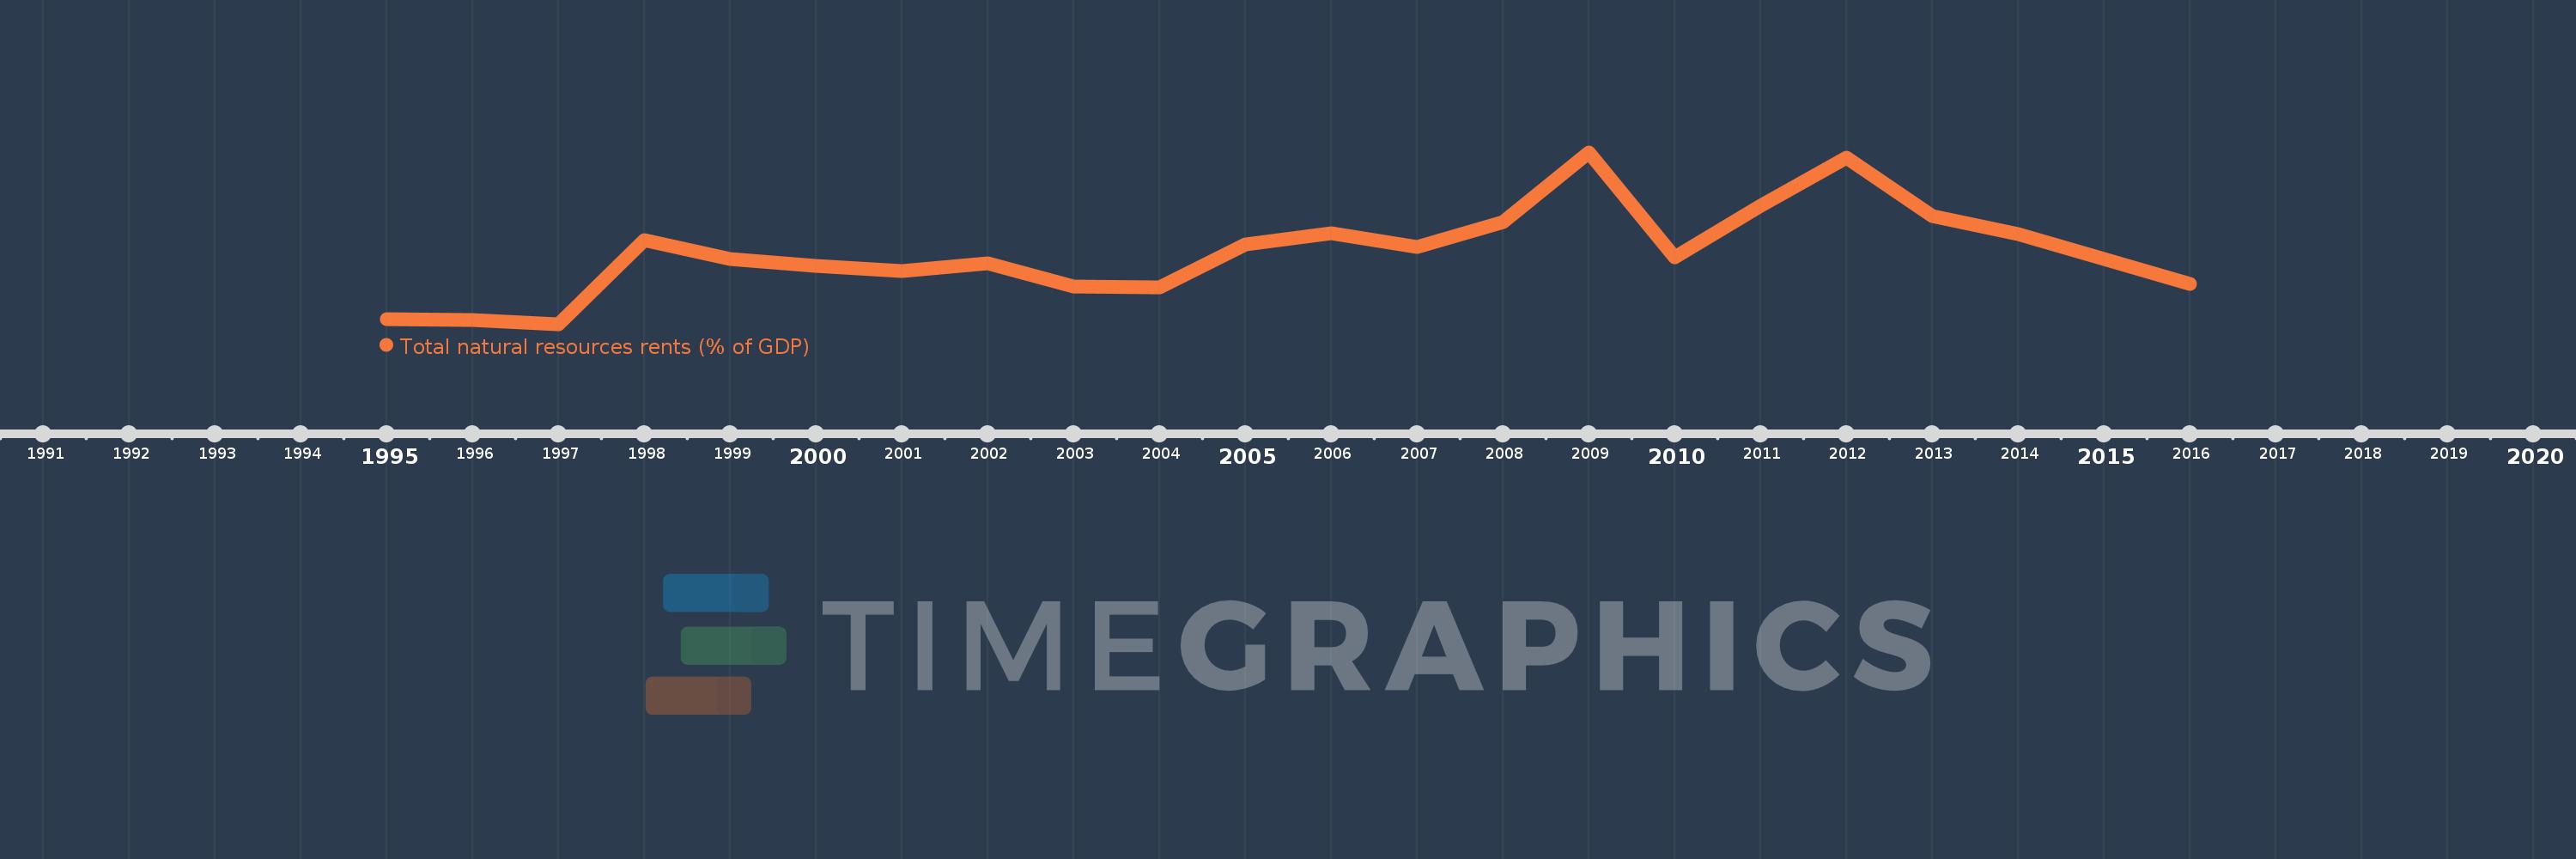
This timeline shows a graph from 1995 to 2016 of Bosnia and Herzegovina. No data until 1994. Number of actual observations by date: 22.
Source name:
World Development Indicators
Source organization:
Estimates based on sources and methods described in "The Changing Wealth of Nations: Measuring Sustainable Development in the New Millennium" (World Bank, 2011).
Categories, topics:
Energy & Mining, Environment
Last updated:
apr 23, 2017
Indicators value changes by year
Meaning:
1.629
Minimum:
0.069
jan 1, 1997
Maximum:
3.795
jan 1, 2009
At the date of observation
Value
Absolute change
Change from the previous value
jan 1, 1995
0.181
+0.181
0.0%
jan 1, 1996
0.154
-0.027
-15.1%
jan 1, 1997
0.069
-0.084
-54.8%
jan 1, 1998
1.891
+1.822
2.63K%
jan 1, 1999
1.491
-0.4
-21.14%
jan 1, 2000
1.335
-0.157
-10.5%
jan 1, 2001
1.225
-0.11
-8.22%
jan 1, 2002
1.382
+0.156
12.77%
jan 1, 2003
0.881
-0.5
-36.21%
jan 1, 2004
0.875
-0.006
-0.69%
jan 1, 2005
1.791
+0.916
104.68%
jan 1, 2006
2.037
+0.246
13.73%
jan 1, 2007
1.74
-0.298
-14.61%
jan 1, 2008
2.287
+0.547
31.46%
jan 1, 2009
3.795
+1.508
65.93%
jan 1, 2010
1.515
-2.28
-60.07%
jan 1, 2011
2.642
+1.127
74.36%
jan 1, 2012
3.678
+1.036
39.19%
jan 1, 2013
2.407
-1.271
-34.55%
jan 1, 2014
2.016
-0.391
-16.23%
jan 1, 2015
1.485
-0.531
-26.35%
jan 1, 2016
0.952
-0.533
-35.87%
Ranking of countries by current statistics by years