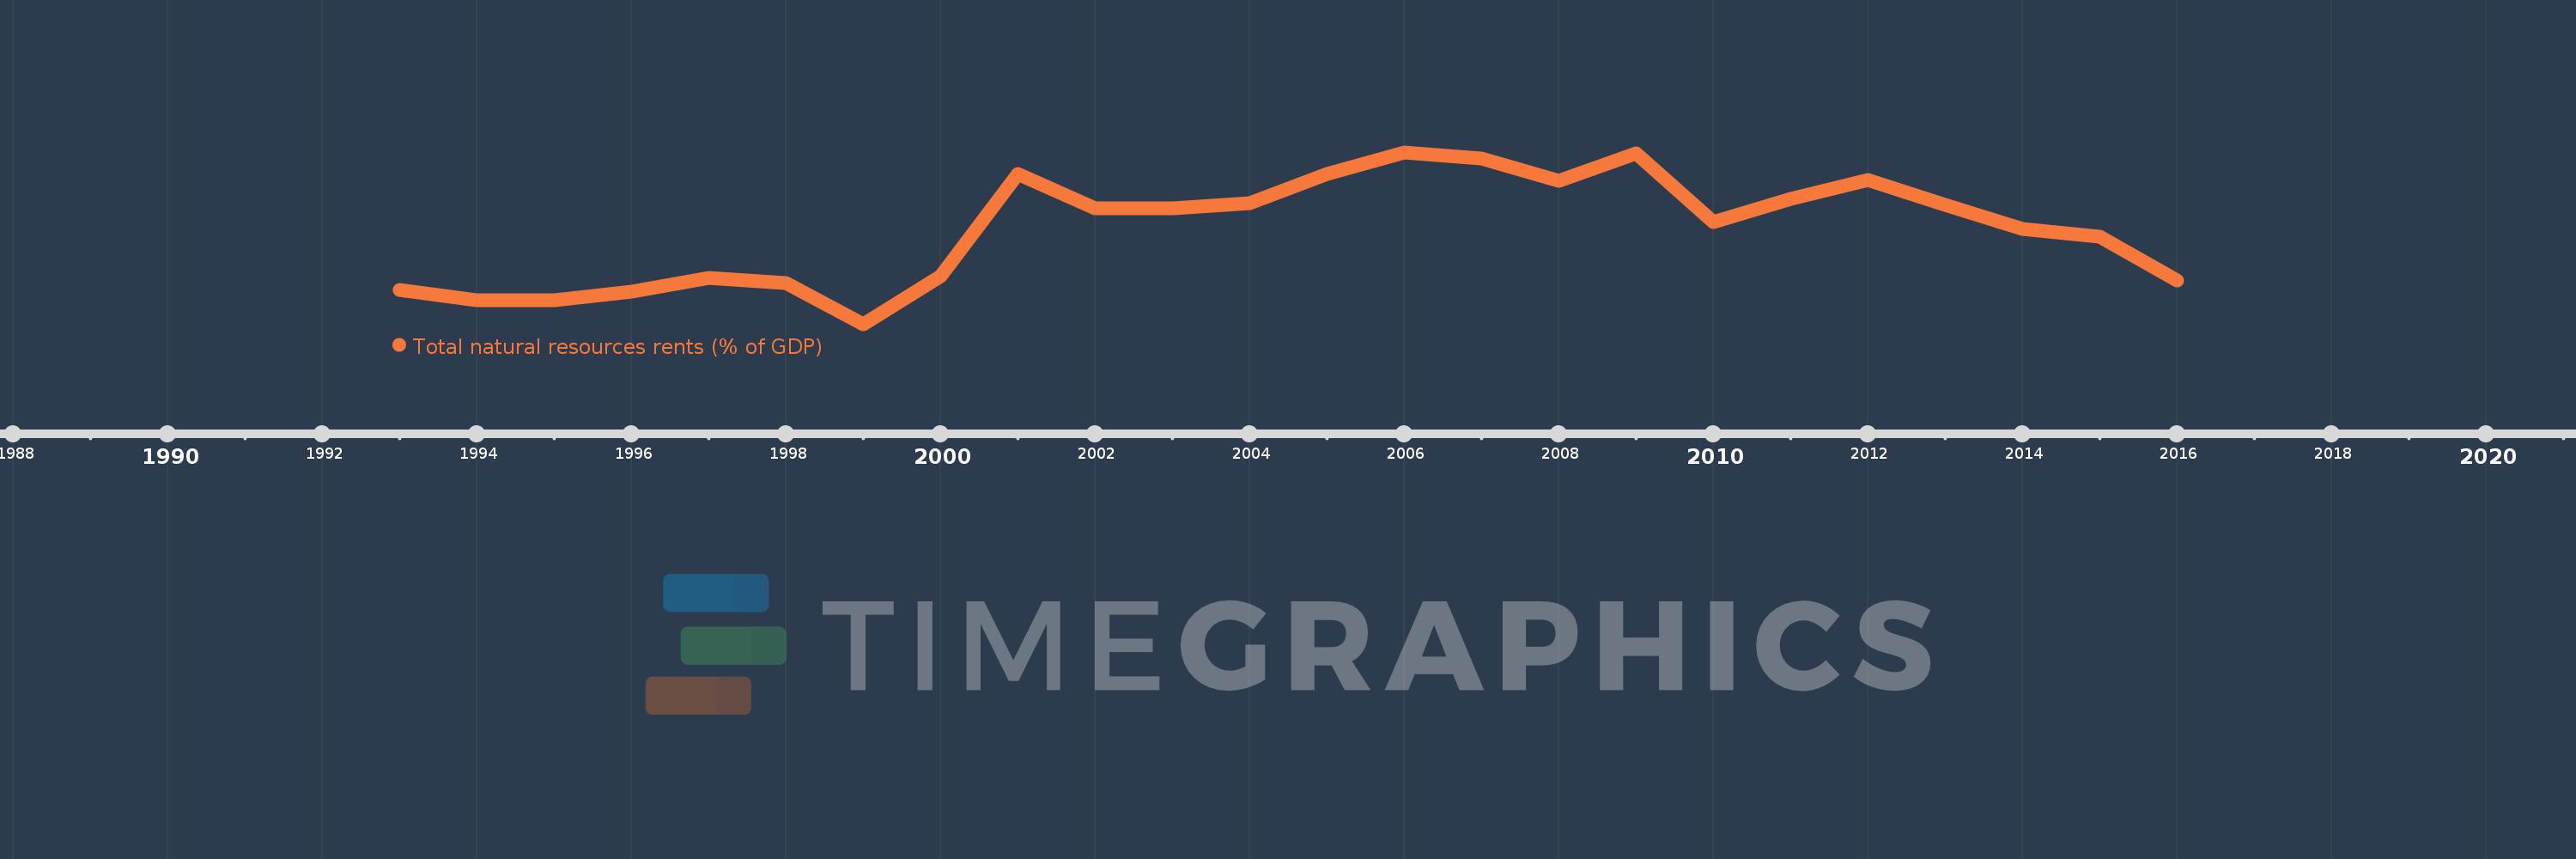
This timeline shows a graph from 1993 to 2016 of Kazakhstan. No data until 1992. Number of actual observations by date: 24.
Source name:
World Development Indicators
Source organization:
Estimates based on sources and methods described in "The Changing Wealth of Nations: Measuring Sustainable Development in the New Millennium" (World Bank, 2011).
Categories, topics:
Energy & Mining, Environment
Last updated:
apr 23, 2017
Indicators value changes by year
Meaning:
16.536
Minimum:
2.801
jan 1, 1999
Maximum:
27.71
jan 1, 2006
At the date of observation
Value
Absolute change
Change from the previous value
jan 1, 1993
7.765
+7.765
0.0%
jan 1, 1994
6.288
-1.477
-19.02%
jan 1, 1995
6.223
-0.065
-1.03%
jan 1, 1996
7.553
+1.329
21.36%
jan 1, 1997
9.562
+2.01
26.61%
jan 1, 1998
8.723
-0.84
-8.78%
jan 1, 1999
2.801
-5.922
-67.89%
jan 1, 2000
9.824
+7.023
250.69%
jan 1, 2001
24.623
+14.799
150.64%
jan 1, 2002
19.598
-5.025
-20.41%
jan 1, 2003
19.628
+0.03
0.15%
jan 1, 2004
20.385
+0.757
3.86%
jan 1, 2005
24.541
+4.156
20.39%
jan 1, 2006
27.71
+3.169
12.91%
jan 1, 2007
26.851
-0.859
-3.1%
jan 1, 2008
23.532
-3.319
-12.36%
jan 1, 2009
27.599
+4.067
17.28%
jan 1, 2010
17.589
-10.01
-36.27%
jan 1, 2011
21.029
+3.44
19.56%
jan 1, 2012
23.675
+2.646
12.58%
jan 1, 2013
20.113
-3.562
-15.04%
jan 1, 2014
16.592
-3.522
-17.51%
jan 1, 2015
15.498
-1.094
-6.59%
jan 1, 2016
9.164
-6.334
-40.87%
Ranking of countries by current statistics by years