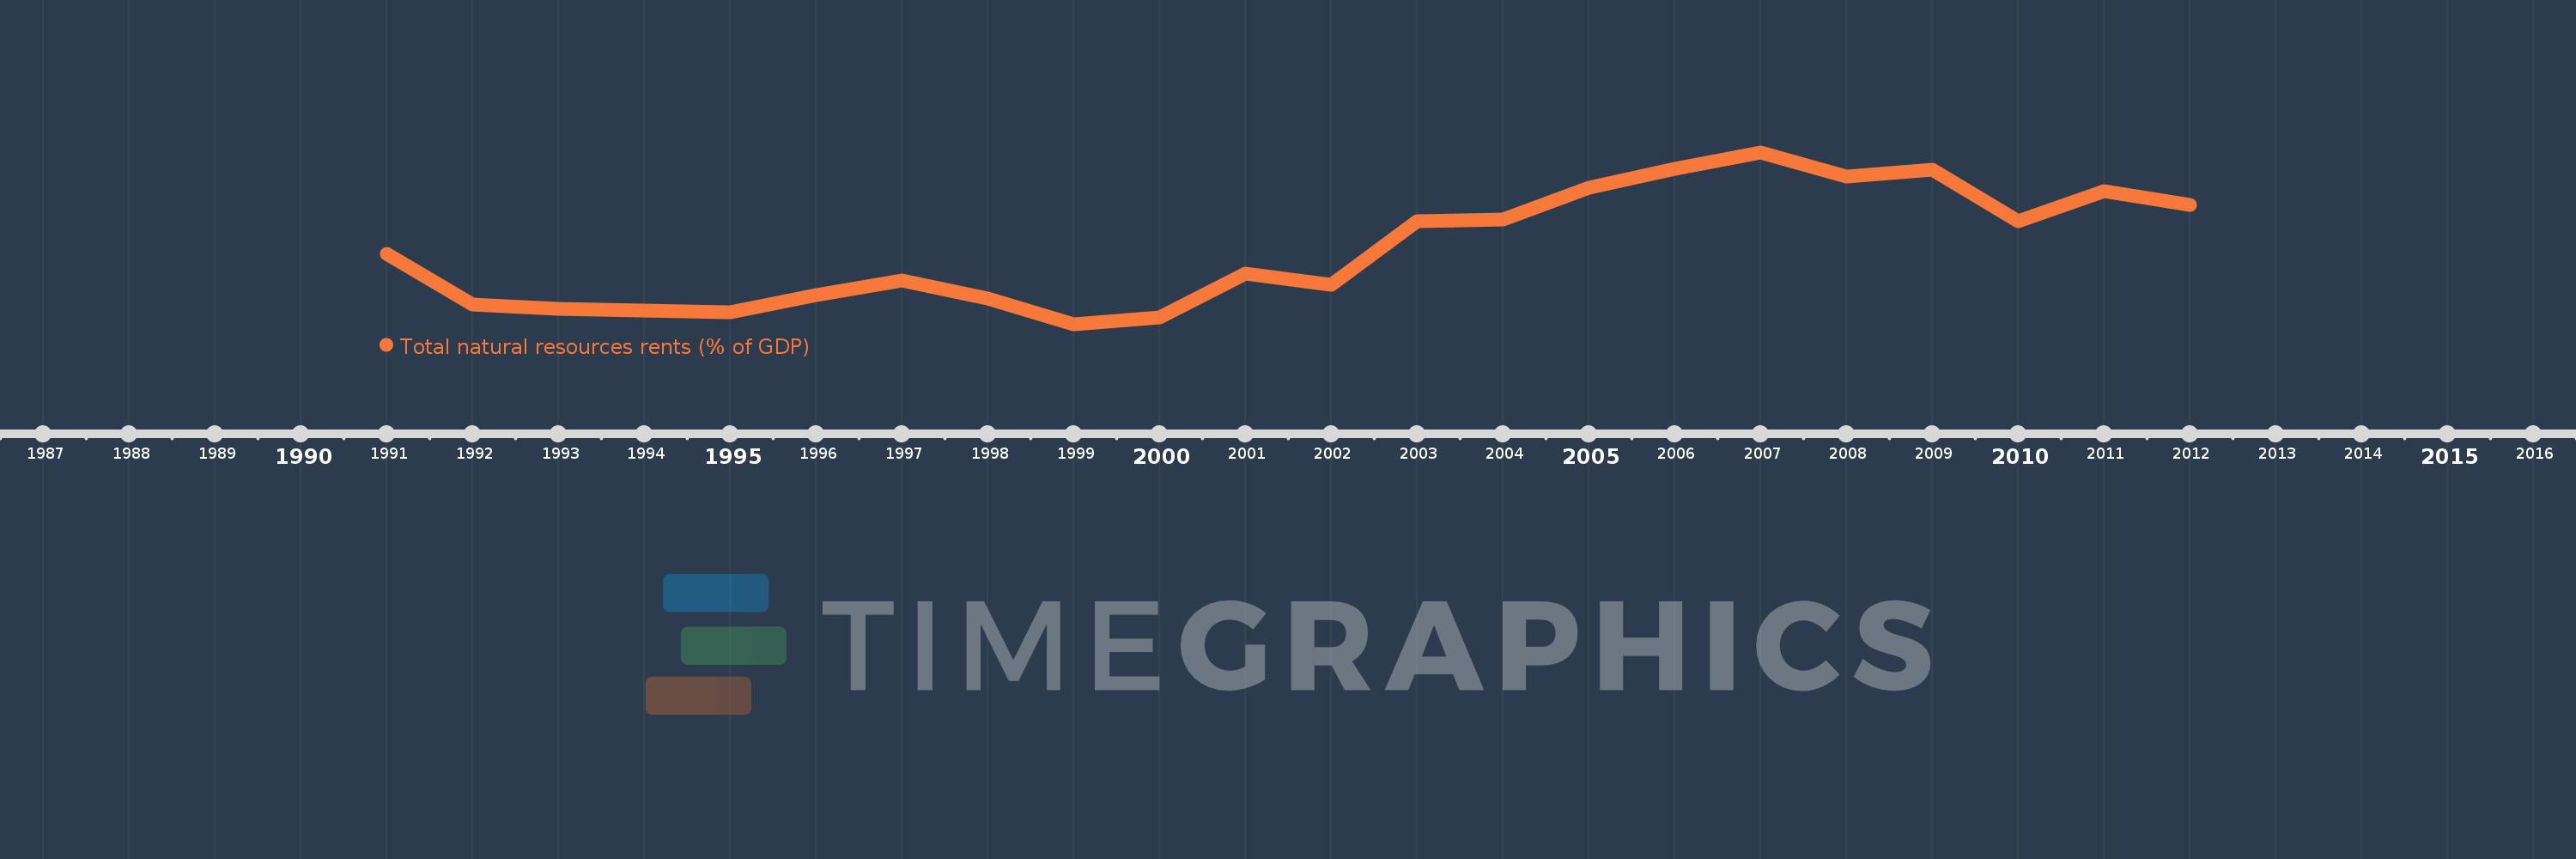
This timeline shows a graph from 1991 to 2012 of Libya. No data until 1990. Number of actual observations by date: 22.
Source name:
World Development Indicators
Source organization:
Estimates based on sources and methods described in "The Changing Wealth of Nations: Measuring Sustainable Development in the New Millennium" (World Bank, 2011).
Categories, topics:
Energy & Mining, Environment
Last updated:
apr 23, 2017
Indicators value changes by year
Meaning:
37.606
Minimum:
15.088
jan 1, 1999
Maximum:
66.476
jan 1, 2007
At the date of observation
Value
Absolute change
Change from the previous value
jan 1, 1991
36.11
+36.11
0.0%
jan 1, 1992
20.877
-15.233
-42.18%
jan 1, 1993
19.705
-1.172
-5.62%
jan 1, 1994
19.235
-0.47
-2.38%
jan 1, 1995
18.635
-0.6
-3.12%
jan 1, 1996
23.725
+5.09
27.31%
jan 1, 1997
28.223
+4.498
18.96%
jan 1, 1998
22.743
-5.48
-19.42%
jan 1, 1999
15.088
-7.655
-33.66%
jan 1, 2000
17.09
+2.002
13.27%
jan 1, 2001
30.314
+13.224
77.38%
jan 1, 2002
27.009
-3.305
-10.9%
jan 1, 2003
45.861
+18.852
69.8%
jan 1, 2004
46.33
+0.469
1.02%
jan 1, 2005
55.913
+9.583
20.68%
jan 1, 2006
61.683
+5.77
10.32%
jan 1, 2007
66.476
+4.793
7.77%
jan 1, 2008
59.339
-7.137
-10.74%
jan 1, 2009
61.354
+2.015
3.4%
jan 1, 2010
45.781
-15.573
-25.38%
jan 1, 2011
54.983
+9.202
20.1%
jan 1, 2012
50.86
-4.123
-7.5%
Ranking of countries by current statistics by years