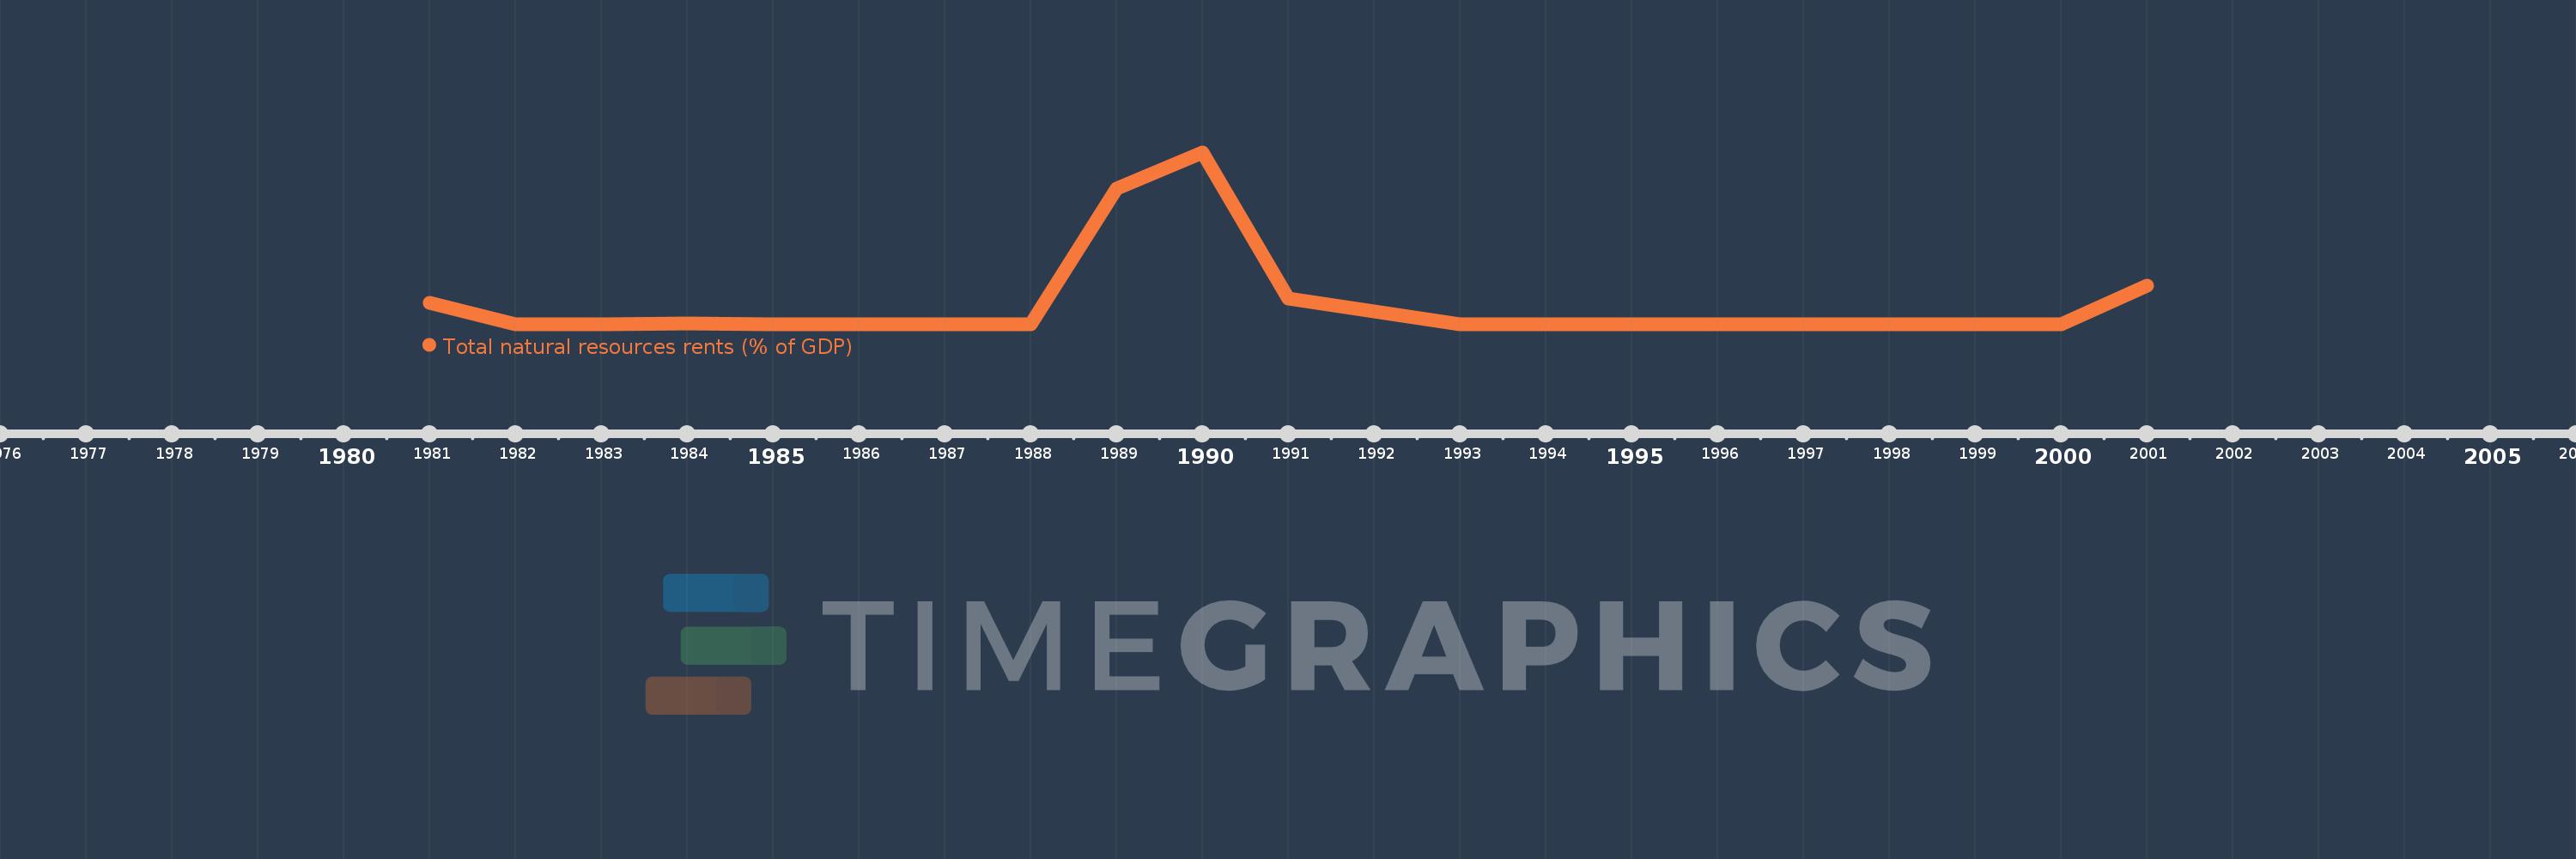
This timeline shows a graph from 1981 to 2001 of New Caledonia. No data until 1980. Number of actual observations by date: 21.
Source name:
World Development Indicators
Source organization:
Estimates based on sources and methods described in "The Changing Wealth of Nations: Measuring Sustainable Development in the New Millennium" (World Bank, 2011).
Categories, topics:
Energy & Mining, Environment
Last updated:
apr 23, 2017
Indicators value changes by year
Meaning:
2.937
Minimum:
0.009
jan 1, 1994
Maximum:
25.911
jan 1, 1990
At the date of observation
Value
Absolute change
Change from the previous value
jan 1, 1981
3.242
+3.242
0.0%
jan 1, 1982
0.041
-3.201
-98.75%
jan 1, 1983
0.059
+0.019
46.56%
jan 1, 1984
0.061
+0.002
3.22%
jan 1, 1985
0.043
-0.018
-29.73%
jan 1, 1986
0.04
-0.003
-6.31%
jan 1, 1987
0.035
-0.005
-12.3%
jan 1, 1988
0.033
-0.002
-5.8%
jan 1, 1989
20.409
+20.376
61.13K%
jan 1, 1990
25.911
+5.501
26.95%
jan 1, 1991
3.891
-22.019
-84.98%
jan 1, 1992
1.953
-1.938
-49.8%
jan 1, 1993
0.013
-1.941
-99.34%
jan 1, 1994
0.009
-0.004
-29.69%
jan 1, 1995
0.012
+0.003
29.05%
jan 1, 1996
0.012
+0.001
7.15%
jan 1, 1997
0.013
+0.0
3.1%
jan 1, 1998
0.012
-0.001
-10.57%
jan 1, 1999
0.018
+0.006
52.29%
jan 1, 2000
0.014
-0.003
-17.48%
jan 1, 2001
5.863
+5.848
40.38K%
Ranking of countries by current statistics by years