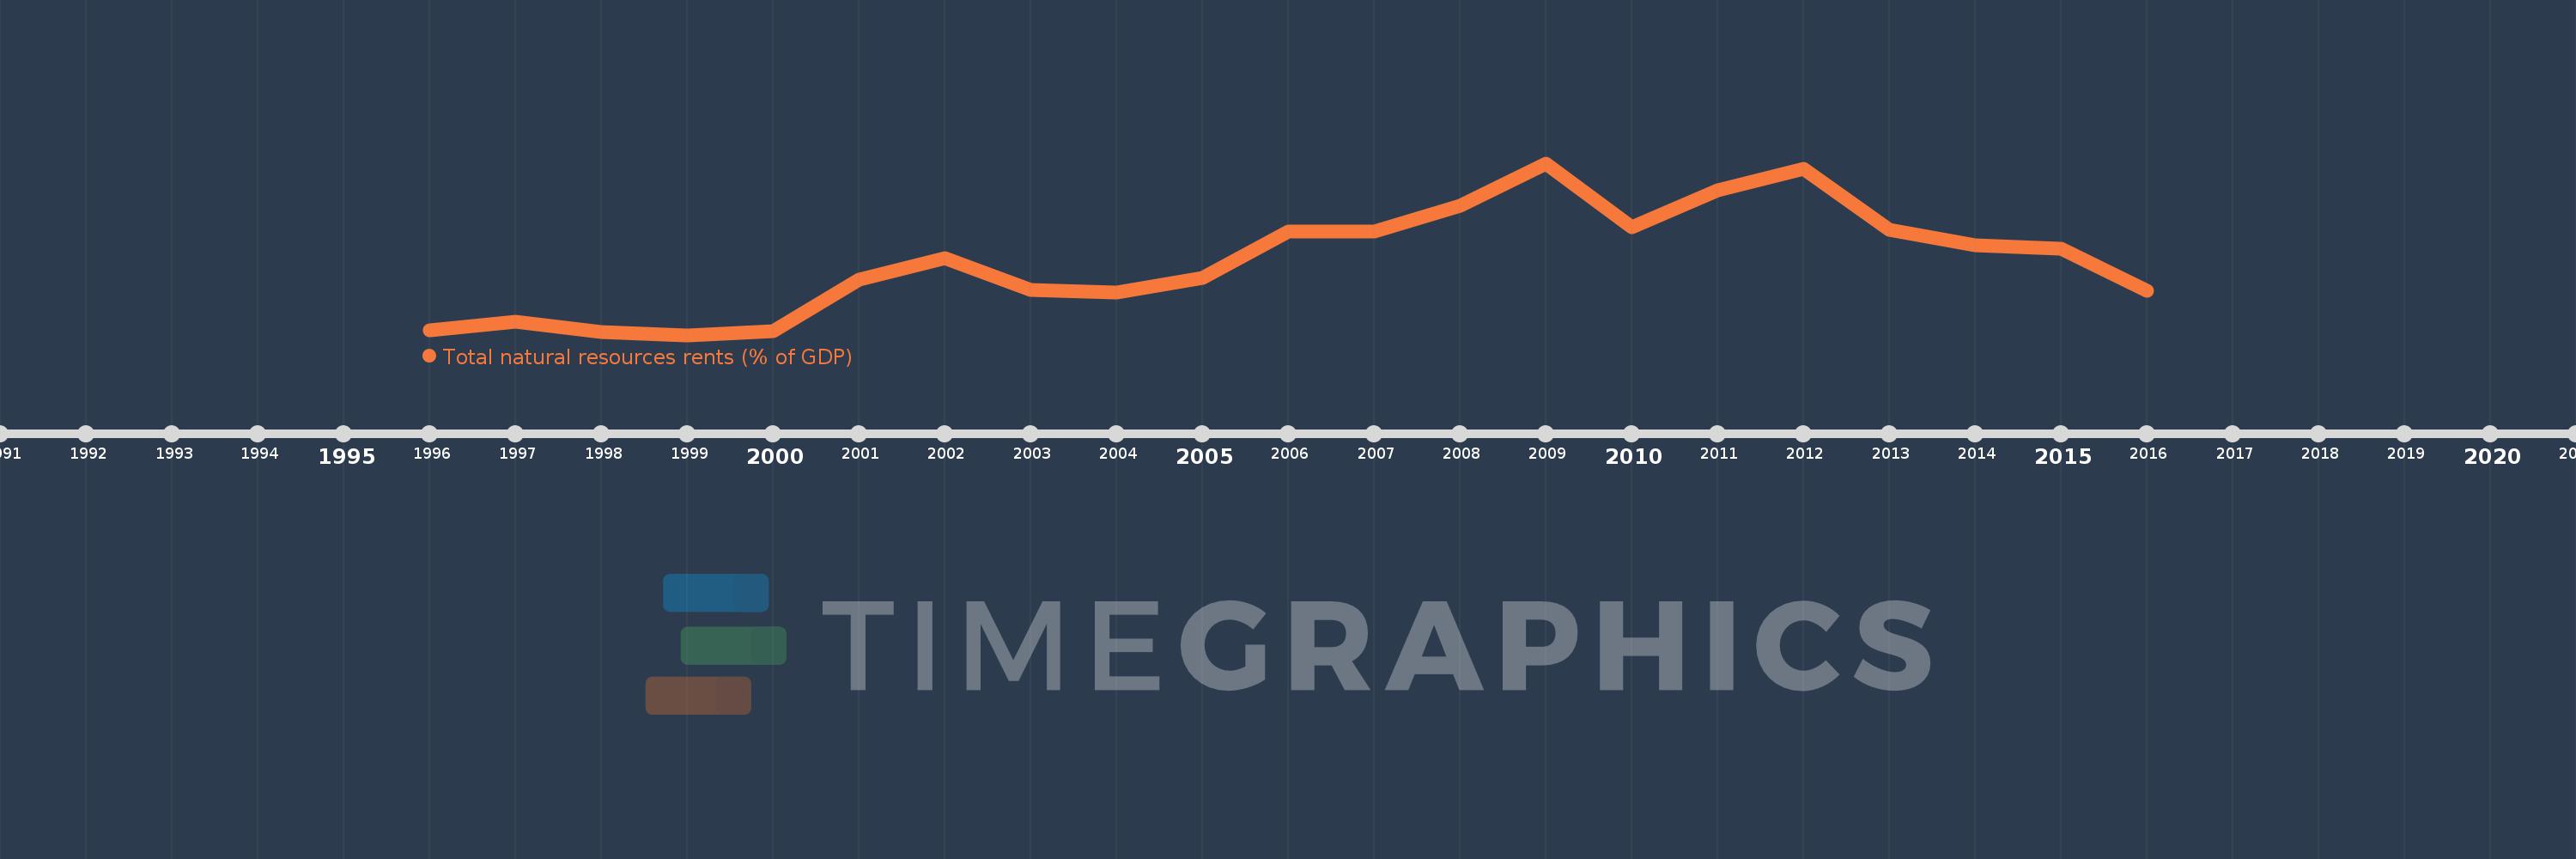
This timeline shows a graph from 1996 to 2016 of Ukraine. No data until 1995. Number of actual observations by date: 21.
Source name:
World Development Indicators
Source organization:
Estimates based on sources and methods described in "The Changing Wealth of Nations: Measuring Sustainable Development in the New Millennium" (World Bank, 2011).
Categories, topics:
Energy & Mining, Environment
Last updated:
apr 23, 2017
Indicators value changes by year
Meaning:
5.25
Minimum:
1.919
jan 1, 1999
Maximum:
9.642
jan 1, 2009
At the date of observation
Value
Absolute change
Change from the previous value
jan 1, 1996
2.141
+2.141
0.0%
jan 1, 1997
2.503
+0.361
16.88%
jan 1, 1998
2.071
-0.432
-17.25%
jan 1, 1999
1.919
-0.152
-7.34%
jan 1, 2000
2.088
+0.169
8.78%
jan 1, 2001
4.419
+2.332
111.7%
jan 1, 2002
5.369
+0.95
21.48%
jan 1, 2003
3.959
-1.41
-26.25%
jan 1, 2004
3.835
-0.124
-3.14%
jan 1, 2005
4.503
+0.668
17.41%
jan 1, 2006
6.59
+2.087
46.34%
jan 1, 2007
6.583
-0.007
-0.11%
jan 1, 2008
7.733
+1.15
17.48%
jan 1, 2009
9.642
+1.909
24.68%
jan 1, 2010
6.747
-2.895
-30.02%
jan 1, 2011
8.431
+1.684
24.96%
jan 1, 2012
9.378
+0.947
11.23%
jan 1, 2013
6.668
-2.71
-28.9%
jan 1, 2014
5.951
-0.717
-10.75%
jan 1, 2015
5.813
-0.138
-2.32%
jan 1, 2016
3.9
-1.913
-32.91%
Ranking of countries by current statistics by years