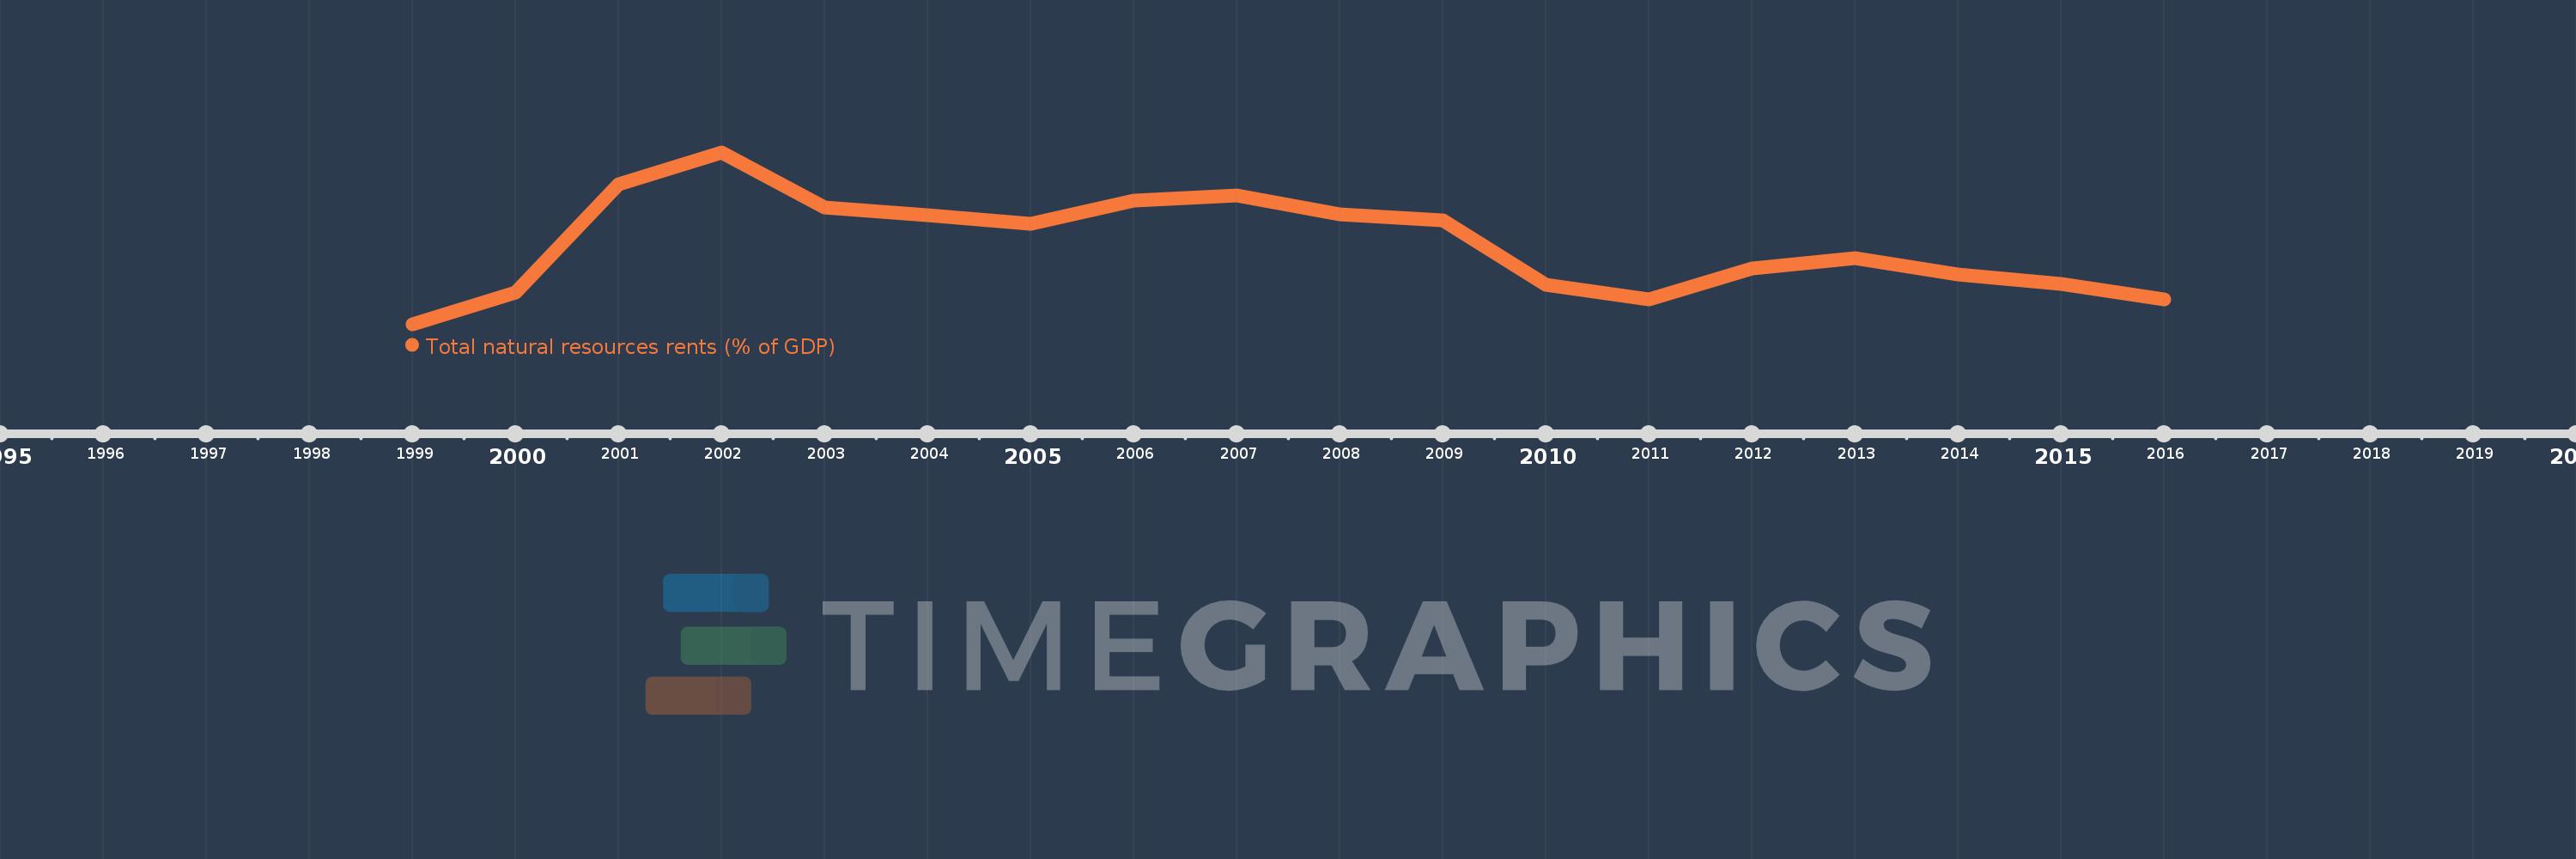
This timeline shows a graph from 1999 to 2016 of Turkmenistan. No data until 1998. Number of actual observations by date: 18.
Source name:
World Development Indicators
Source organization:
Estimates based on sources and methods described in "The Changing Wealth of Nations: Measuring Sustainable Development in the New Millennium" (World Bank, 2011).
Categories, topics:
Energy & Mining, Environment
Last updated:
apr 23, 2017
Indicators value changes by year
Meaning:
42.417
Minimum:
8.421
jan 1, 1999
Maximum:
81.609
jan 1, 2002
At the date of observation
Value
Absolute change
Change from the previous value
jan 1, 1999
8.421
+8.421
0.0%
jan 1, 2000
21.791
+13.371
158.78%
jan 1, 2001
68.2
+46.408
212.97%
jan 1, 2002
81.609
+13.409
19.66%
jan 1, 2003
58.209
-23.4
-28.67%
jan 1, 2004
54.802
-3.407
-5.85%
jan 1, 2005
51.104
-3.698
-6.75%
jan 1, 2006
61.053
+9.949
19.47%
jan 1, 2007
63.221
+2.167
3.55%
jan 1, 2008
55.132
-8.088
-12.79%
jan 1, 2009
52.846
-2.286
-4.15%
jan 1, 2010
25.264
-27.582
-52.19%
jan 1, 2011
19.079
-6.185
-24.48%
jan 1, 2012
32.159
+13.081
68.56%
jan 1, 2013
36.654
+4.495
13.98%
jan 1, 2014
29.451
-7.203
-19.65%
jan 1, 2015
25.578
-3.873
-13.15%
jan 1, 2016
18.928
-6.65
-26.0%
Ranking of countries by current statistics by years