33
/
AIzaSyAYiBZKx7MnpbEhh9jyipgxe19OcubqV5w
August 1, 2025
153173
Hungary
HUN
true
2
1
Total natural resources rents (% of GDP)
2016,2015,2014,2013,2012,2011,2010,2009,2008,2007,2006,2005,2004,2003,2002,2001,2000,1999,1998,1997,1996,1995,1994,1993,1992
Download
Global statistics library →Hungary →

Total natural resources rents (% of GDP)

This statistics in other country:

AfghanistanAlbaniaAlgeriaAngolaArab WorldArgentinaArmeniaArubaAustraliaAustriaAzerbaijanBahamas, TheBahrainBangladeshBarbadosBelarusBelgiumBelizeBeninBhutanBoliviaBosnia and HerzegovinaBotswanaBrazilBrunei DarussalamBulgariaBurkina FasoBurundiCabo VerdeCambodiaCameroonCanadaCaribbean small statesCentral African RepublicCentral Europe and the BalticsChadChileChinaColombiaComorosCongo, Dem. Rep.Congo, Rep.Costa RicaCote d'IvoireCroatiaCubaCyprusCzech RepublicDenmarkDjiboutiDominicaDominican RepublicEarly-demographic dividendEast Asia & PacificEast Asia & Pacific (excluding high income)East Asia & Pacific (IDA & IBRD countries)EcuadorEgypt, Arab Rep.El SalvadorEquatorial GuineaEritreaEstoniaEthiopiaEuro areaEurope & Central AsiaEurope & Central Asia (excluding high income)Europe & Central Asia (IDA & IBRD countries)European UnionFijiFinlandFragile and conflict affected situationsFranceFrench PolynesiaGabonGambia, TheGeorgiaGermanyGhanaGreeceGuatemalaGuineaGuinea-BissauGuyanaHaitiHeavily indebted poor countries (HIPC)High incomeHondurasHong Kong SAR, ChinaHungaryIBRD onlyIcelandIDA & IBRD totalIDA blendIDA onlyIDA totalIndiaIndonesiaIran, Islamic Rep.IraqIrelandIsraelItalyJamaicaJapanJordanKazakhstanKenyaKiribatiKorea, Rep.KuwaitKyrgyz RepublicLao PDRLate-demographic dividendLatin America & Caribbean Latin America & Caribbean (excluding high income)Latin America & the Caribbean (IDA & IBRD countries)LatviaLeast developed countries: UN classificationLebanonLesothoLiberiaLibyaLithuaniaLow & middle incomeLow incomeLower middle incomeLuxembourgMacao SAR, ChinaMacedonia, FYRMadagascarMalawiMalaysiaMaldivesMaliMaltaMauritaniaMauritiusMexicoMiddle East & North AfricaMiddle East & North Africa (excluding high income)Middle East & North Africa (IDA & IBRD countries)Middle incomeMoldovaMongoliaMontenegroMoroccoMozambiqueMyanmarNamibiaNepalNetherlandsNew CaledoniaNew ZealandNicaraguaNigerNigeriaNorth AmericaNorwayOECD membersOmanOther small statesPacific island small statesPakistanPanamaPapua New GuineaParaguayPeruPhilippinesPolandPortugalPost-demographic dividendPre-demographic dividendQatarRomaniaRussian FederationRwandaSamoaSao Tome and PrincipeSaudi ArabiaSenegalSerbiaSeychellesSierra LeoneSingaporeSlovak RepublicSloveniaSmall statesSolomon IslandsSouth AfricaSouth AsiaSouth Asia (IDA & IBRD)South SudanSpainSri LankaSt. LuciaSt. Vincent and the GrenadinesSub-Saharan Africa Sub-Saharan Africa (excluding high income)Sub-Saharan Africa (IDA & IBRD countries)SudanSurinameSwazilandSwedenSwitzerlandSyrian Arab RepublicTajikistanTanzaniaThailandTimor-LesteTogoTongaTrinidad and TobagoTunisiaTurkeyTurkmenistanUgandaUkraineUnited Arab EmiratesUnited KingdomUnited StatesUpper middle incomeUruguayUzbekistanVanuatuVenezuela, RBVietnamWorldYemen, Rep.ZambiaZimbabwe

Timeline:

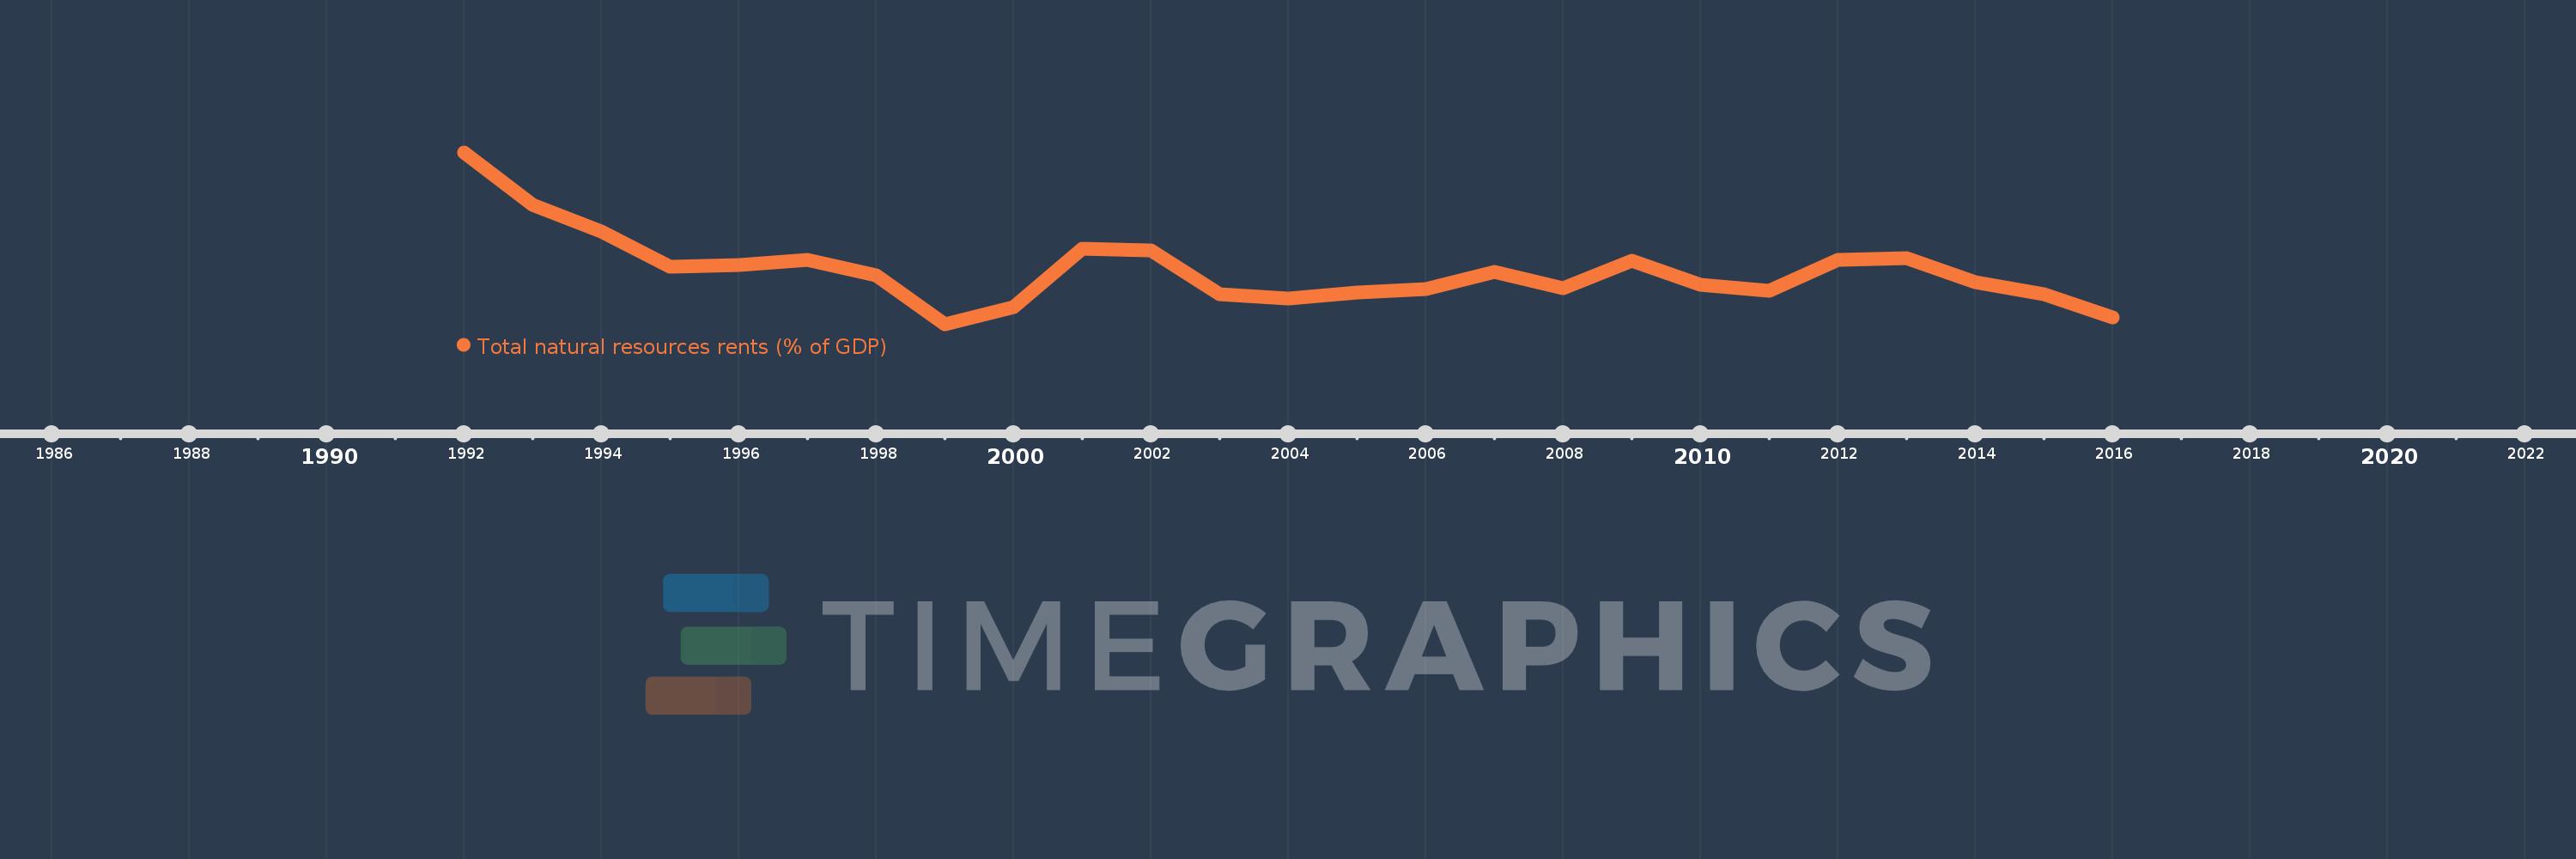
This timeline shows a graph from 1992 to 2016 of Hungary. No data until 1991. Number of actual observations by date: 25.

Source name:

World Development Indicators

Source organization:

Estimates based on sources and methods described in "The Changing Wealth of Nations: Measuring Sustainable Development in the New Millennium" (World Bank, 2011).

Categories, topics:

Energy & Mining, Environment

Last updated:

apr 23, 2017

Indicators value changes by year

Meaning:
0.557
Minimum:
0.266
jan 1, 1999
Maximum:
1.203
jan 1, 1992
At the date of observation
Value
Absolute change
Change from the previous value
jan 1, 1992
1.203
+1.203
0.0%
jan 1, 1993
0.917
-0.286
-23.75%
jan 1, 1994
0.773
-0.145
-15.78%
jan 1, 1995
0.579
-0.193
-25.03%
jan 1, 1996
0.588
+0.009
1.51%
jan 1, 1997
0.618
+0.03
5.17%
jan 1, 1998
0.534
-0.084
-13.67%
jan 1, 1999
0.266
-0.267
-50.11%
jan 1, 2000
0.357
+0.091
34.04%
jan 1, 2001
0.678
+0.321
90.01%
jan 1, 2002
0.667
-0.011
-1.66%
jan 1, 2003
0.43
-0.237
-35.59%
jan 1, 2004
0.405
-0.024
-5.63%
jan 1, 2005
0.438
+0.033
8.12%
jan 1, 2006
0.456
+0.017
3.97%
jan 1, 2007
0.553
+0.097
21.35%
jan 1, 2008
0.462
-0.091
-16.51%
jan 1, 2009
0.61
+0.148
32.13%
jan 1, 2010
0.481
-0.129
-21.11%
jan 1, 2011
0.45
-0.031
-6.51%
jan 1, 2012
0.616
+0.166
36.89%
jan 1, 2013
0.625
+0.009
1.45%
jan 1, 2014
0.495
-0.13
-20.83%
jan 1, 2015
0.43
-0.064
-13.0%
jan 1, 2016
0.305
-0.125
-29.13%

Ranking of countries by current statistics by years