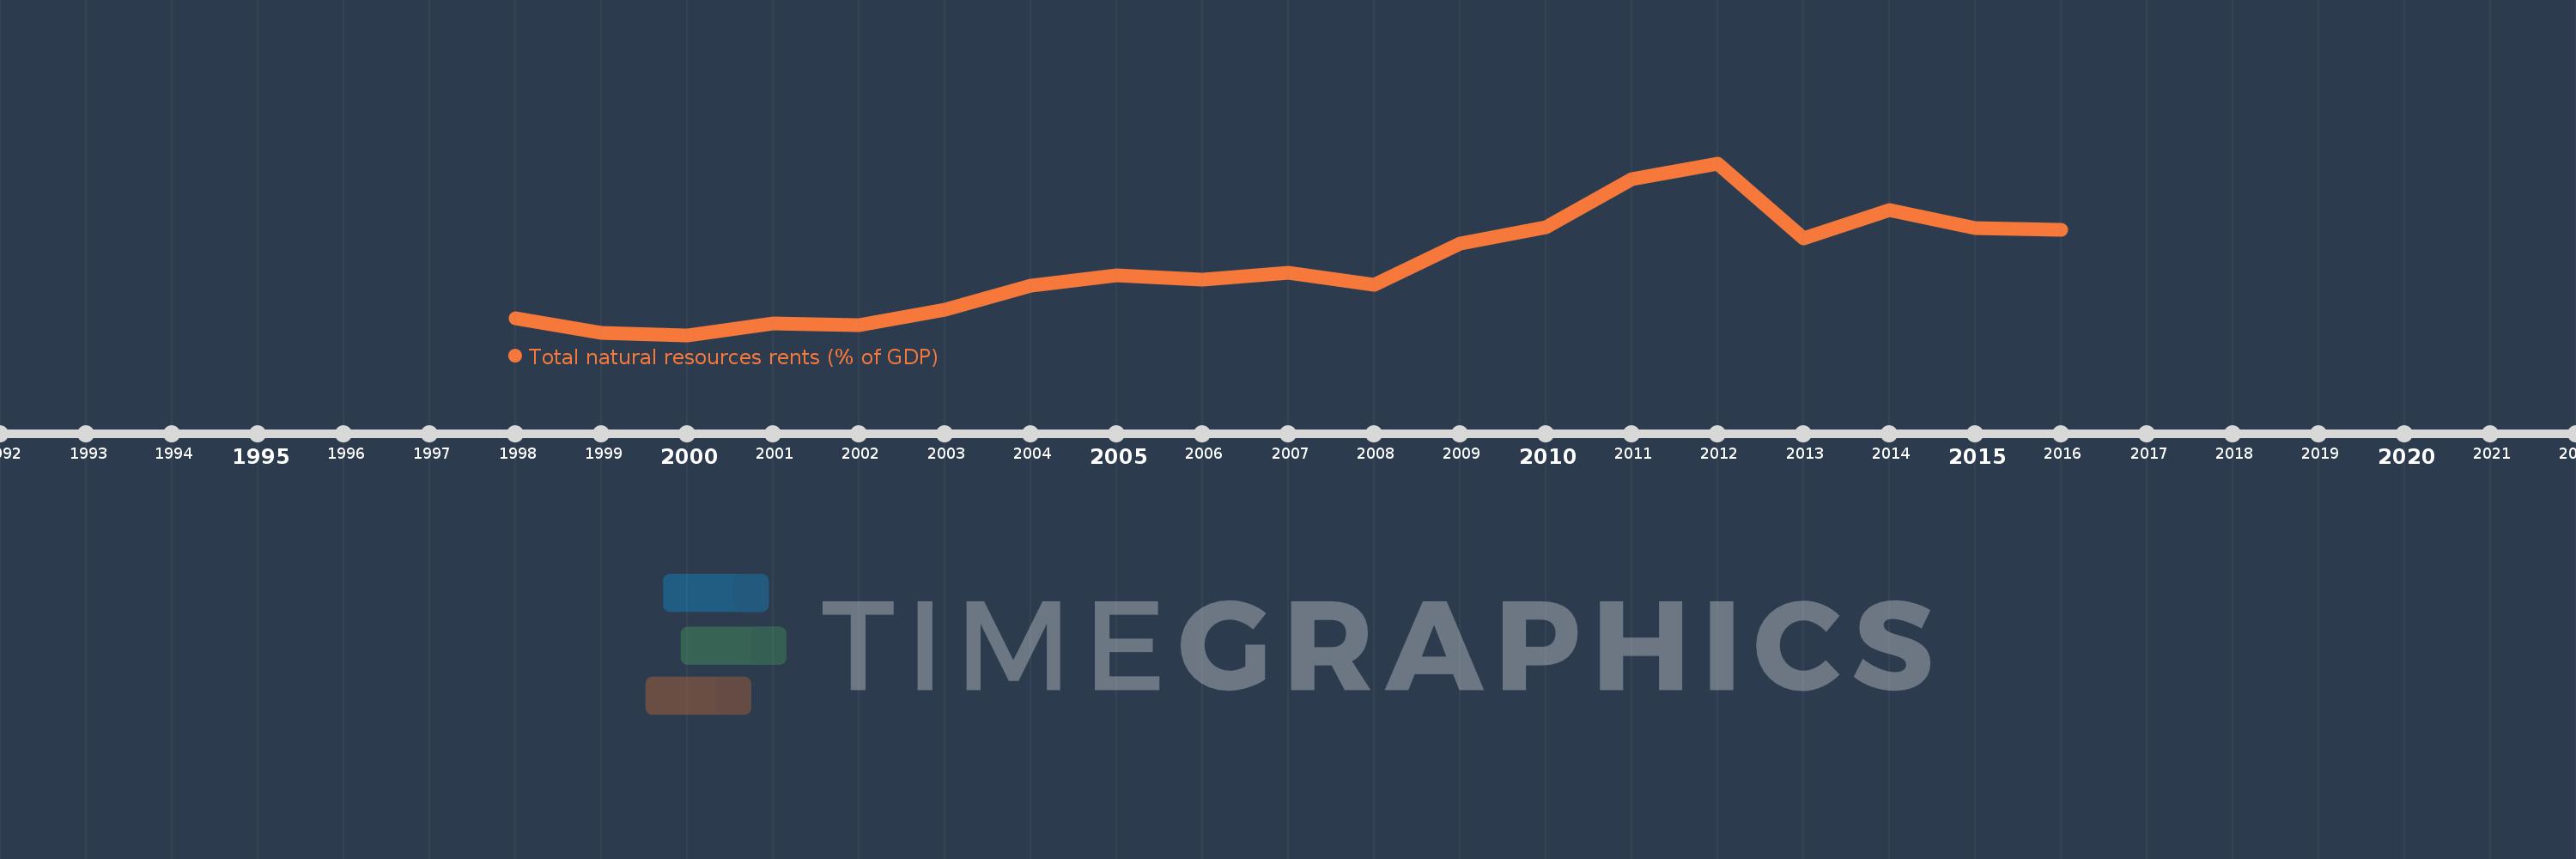
This timeline shows a graph from 1998 to 2016 of Kyrgyz Republic. No data until 1997. Number of actual observations by date: 19.
Source name:
World Development Indicators
Source organization:
Estimates based on sources and methods described in "The Changing Wealth of Nations: Measuring Sustainable Development in the New Millennium" (World Bank, 2011).
Categories, topics:
Energy & Mining, Environment
Last updated:
apr 23, 2017
Indicators value changes by year
Meaning:
5.153
Minimum:
0.346
jan 1, 2000
Maximum:
12.379
jan 1, 2012
At the date of observation
Value
Absolute change
Change from the previous value
jan 1, 1998
1.512
+1.512
0.0%
jan 1, 1999
0.513
-0.999
-66.09%
jan 1, 2000
0.346
-0.167
-32.6%
jan 1, 2001
1.137
+0.792
229.07%
jan 1, 2002
1.067
-0.07
-6.14%
jan 1, 2003
2.148
+1.08
101.21%
jan 1, 2004
3.814
+1.667
77.62%
jan 1, 2005
4.499
+0.684
17.94%
jan 1, 2006
4.216
-0.283
-6.28%
jan 1, 2007
4.713
+0.497
11.78%
jan 1, 2008
3.846
-0.867
-18.39%
jan 1, 2009
6.738
+2.893
75.21%
jan 1, 2010
7.912
+1.174
17.42%
jan 1, 2011
11.278
+3.365
42.53%
jan 1, 2012
12.379
+1.101
9.76%
jan 1, 2013
7.13
-5.249
-42.4%
jan 1, 2014
9.12
+1.99
27.9%
jan 1, 2015
7.832
-1.288
-14.12%
jan 1, 2016
7.705
-0.127
-1.63%
Ranking of countries by current statistics by years