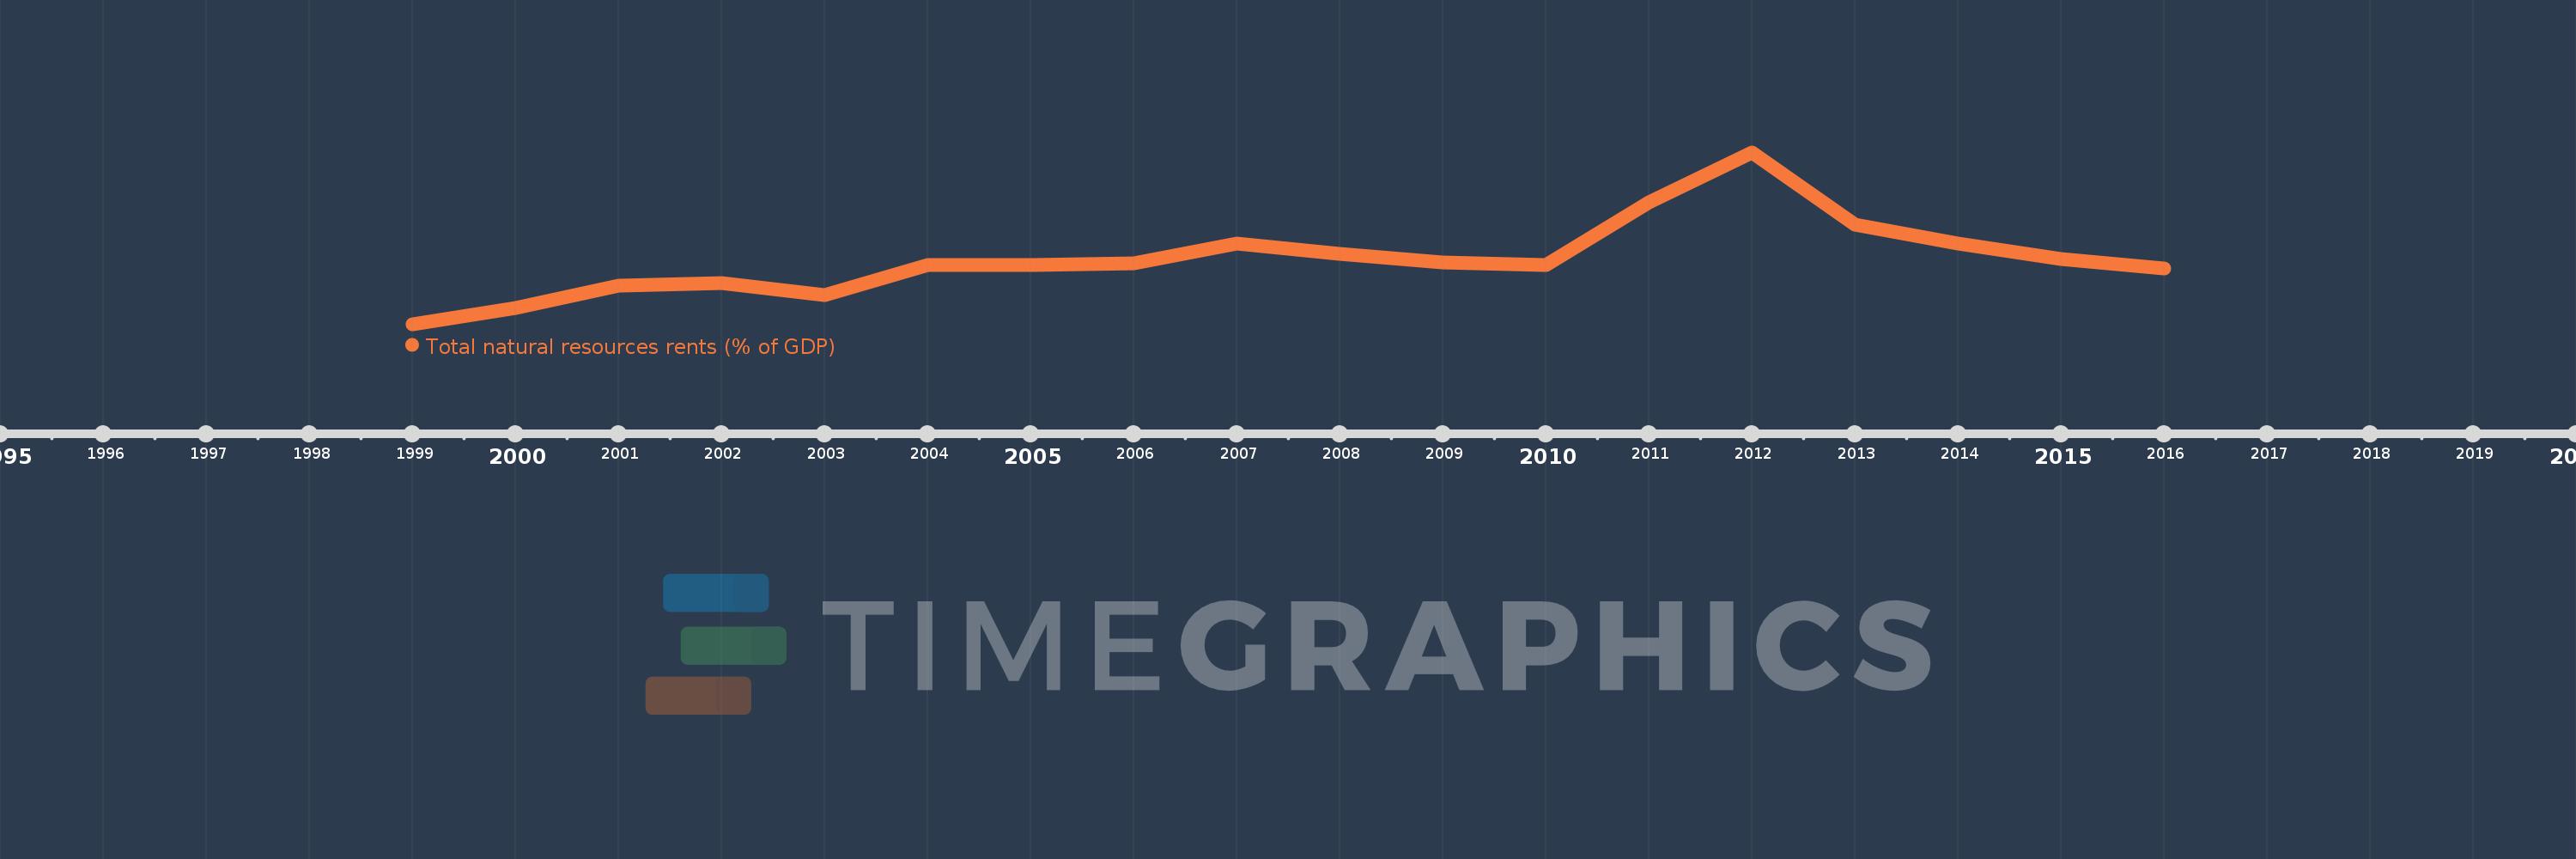
This timeline shows a graph from 1999 to 2016 of Georgia. No data until 1998. Number of actual observations by date: 18.
Source name:
World Development Indicators
Source organization:
Estimates based on sources and methods described in "The Changing Wealth of Nations: Measuring Sustainable Development in the New Millennium" (World Bank, 2011).
Categories, topics:
Energy & Mining, Environment
Last updated:
apr 23, 2017
Indicators value changes by year
Meaning:
1.082
Minimum:
0.21
jan 1, 1999
Maximum:
2.514
jan 1, 2012
At the date of observation
Value
Absolute change
Change from the previous value
jan 1, 1999
0.21
+0.21
0.0%
jan 1, 2000
0.422
+0.212
100.64%
jan 1, 2001
0.728
+0.306
72.47%
jan 1, 2002
0.762
+0.034
4.67%
jan 1, 2003
0.596
-0.166
-21.74%
jan 1, 2004
1.001
+0.404
67.76%
jan 1, 2005
0.998
-0.002
-0.22%
jan 1, 2006
1.031
+0.033
3.27%
jan 1, 2007
1.295
+0.264
25.56%
jan 1, 2008
1.159
-0.136
-10.49%
jan 1, 2009
1.033
-0.125
-10.82%
jan 1, 2010
1.007
-0.027
-2.56%
jan 1, 2011
1.847
+0.84
83.4%
jan 1, 2012
2.514
+0.667
36.1%
jan 1, 2013
1.545
-0.969
-38.55%
jan 1, 2014
1.291
-0.254
-16.42%
jan 1, 2015
1.079
-0.212
-16.44%
jan 1, 2016
0.956
-0.123
-11.38%
Ranking of countries by current statistics by years