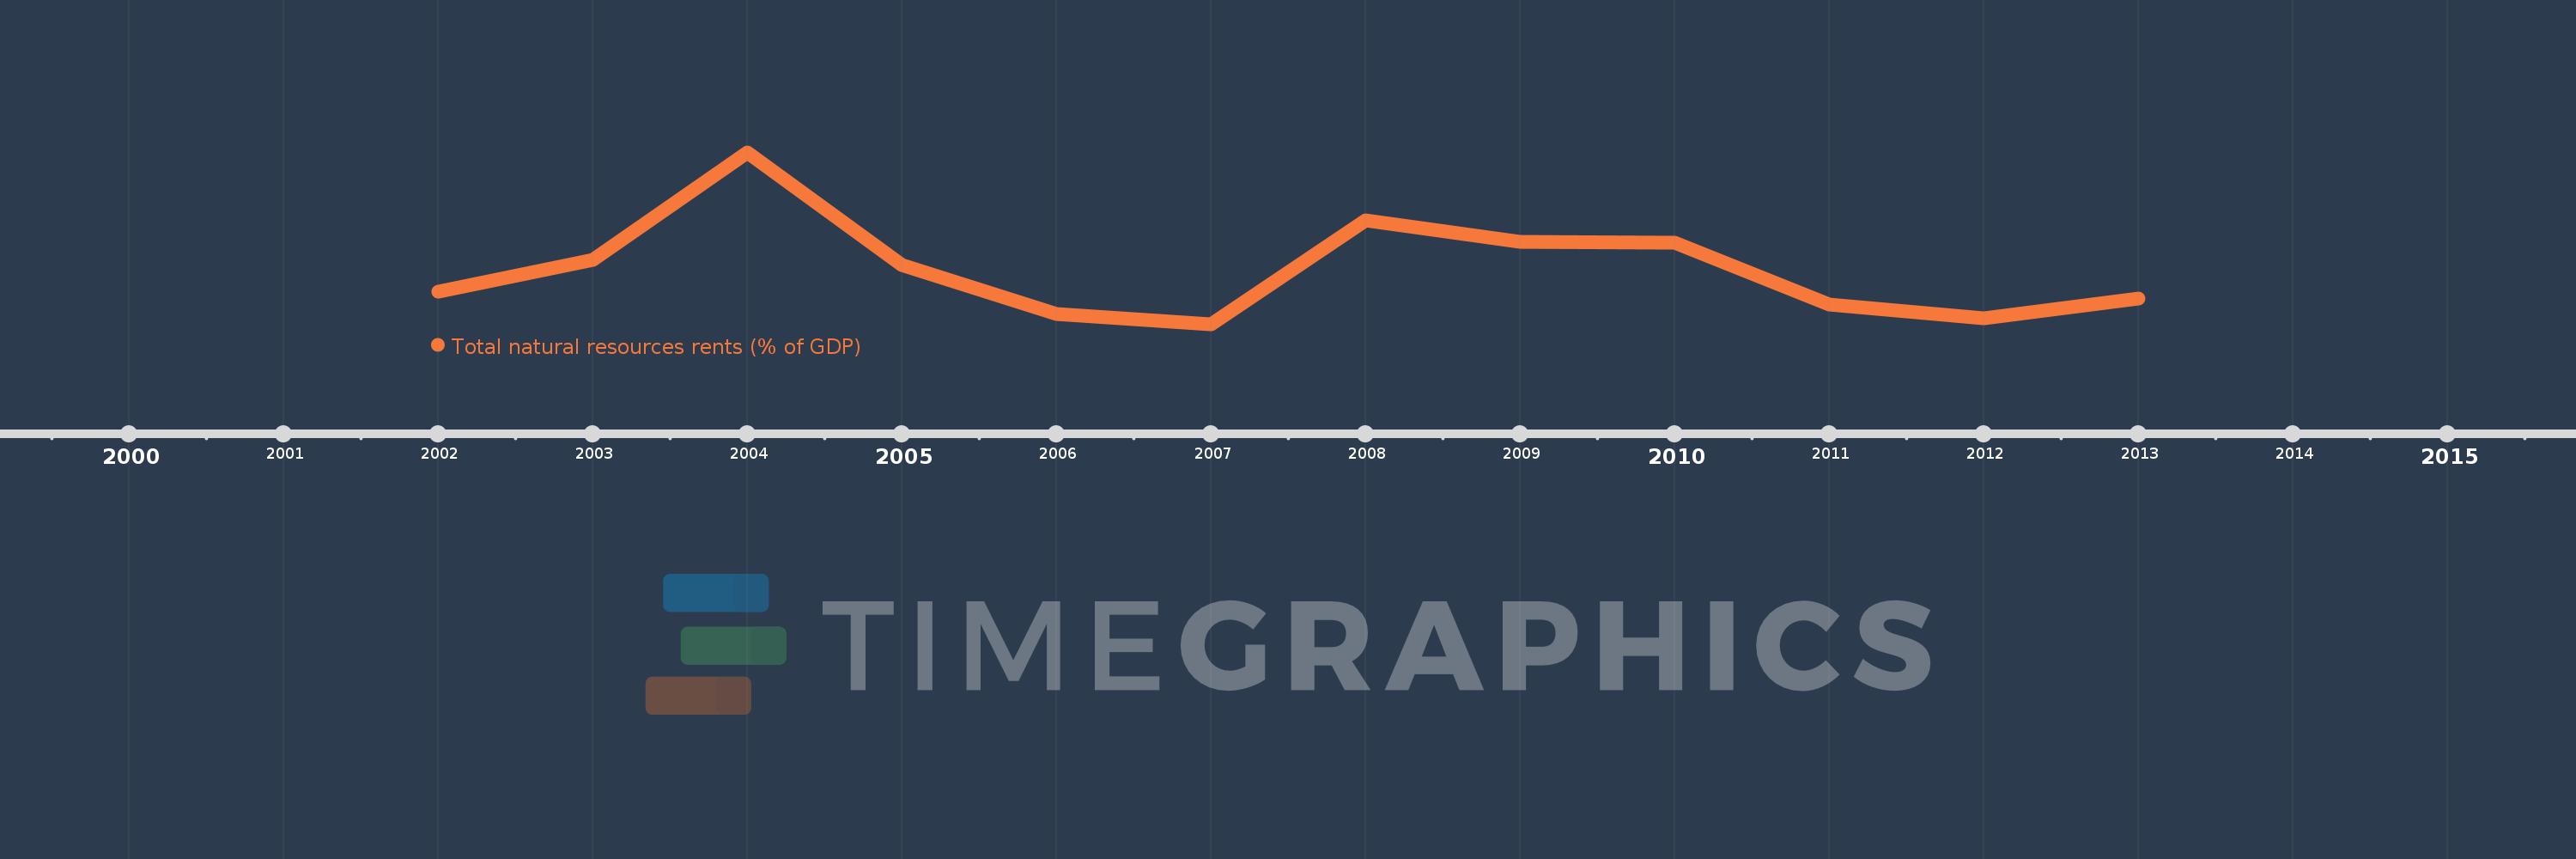
This timeline shows a graph from 2002 to 2013 of Sao Tome and Principe. No data until 2001. Number of actual observations by date: 12.
Source name:
World Development Indicators
Source organization:
Estimates based on sources and methods described in "The Changing Wealth of Nations: Measuring Sustainable Development in the New Millennium" (World Bank, 2011).
Categories, topics:
Energy & Mining, Environment
Last updated:
apr 23, 2017
Indicators value changes by year
Meaning:
3.296
Minimum:
2.85
jan 1, 2007
Maximum:
4.248
jan 1, 2004
At the date of observation
Value
Absolute change
Change from the previous value
jan 1, 2002
3.118
+3.118
0.0%
jan 1, 2003
3.375
+0.257
8.24%
jan 1, 2004
4.248
+0.873
25.85%
jan 1, 2005
3.329
-0.919
-21.63%
jan 1, 2006
2.932
-0.396
-11.9%
jan 1, 2007
2.85
-0.083
-2.82%
jan 1, 2008
3.696
+0.847
29.71%
jan 1, 2009
3.519
-0.177
-4.8%
jan 1, 2010
3.511
-0.008
-0.23%
jan 1, 2011
3.012
-0.499
-14.21%
jan 1, 2012
2.898
-0.114
-3.79%
jan 1, 2013
3.059
+0.161
5.56%
Ranking of countries by current statistics by years