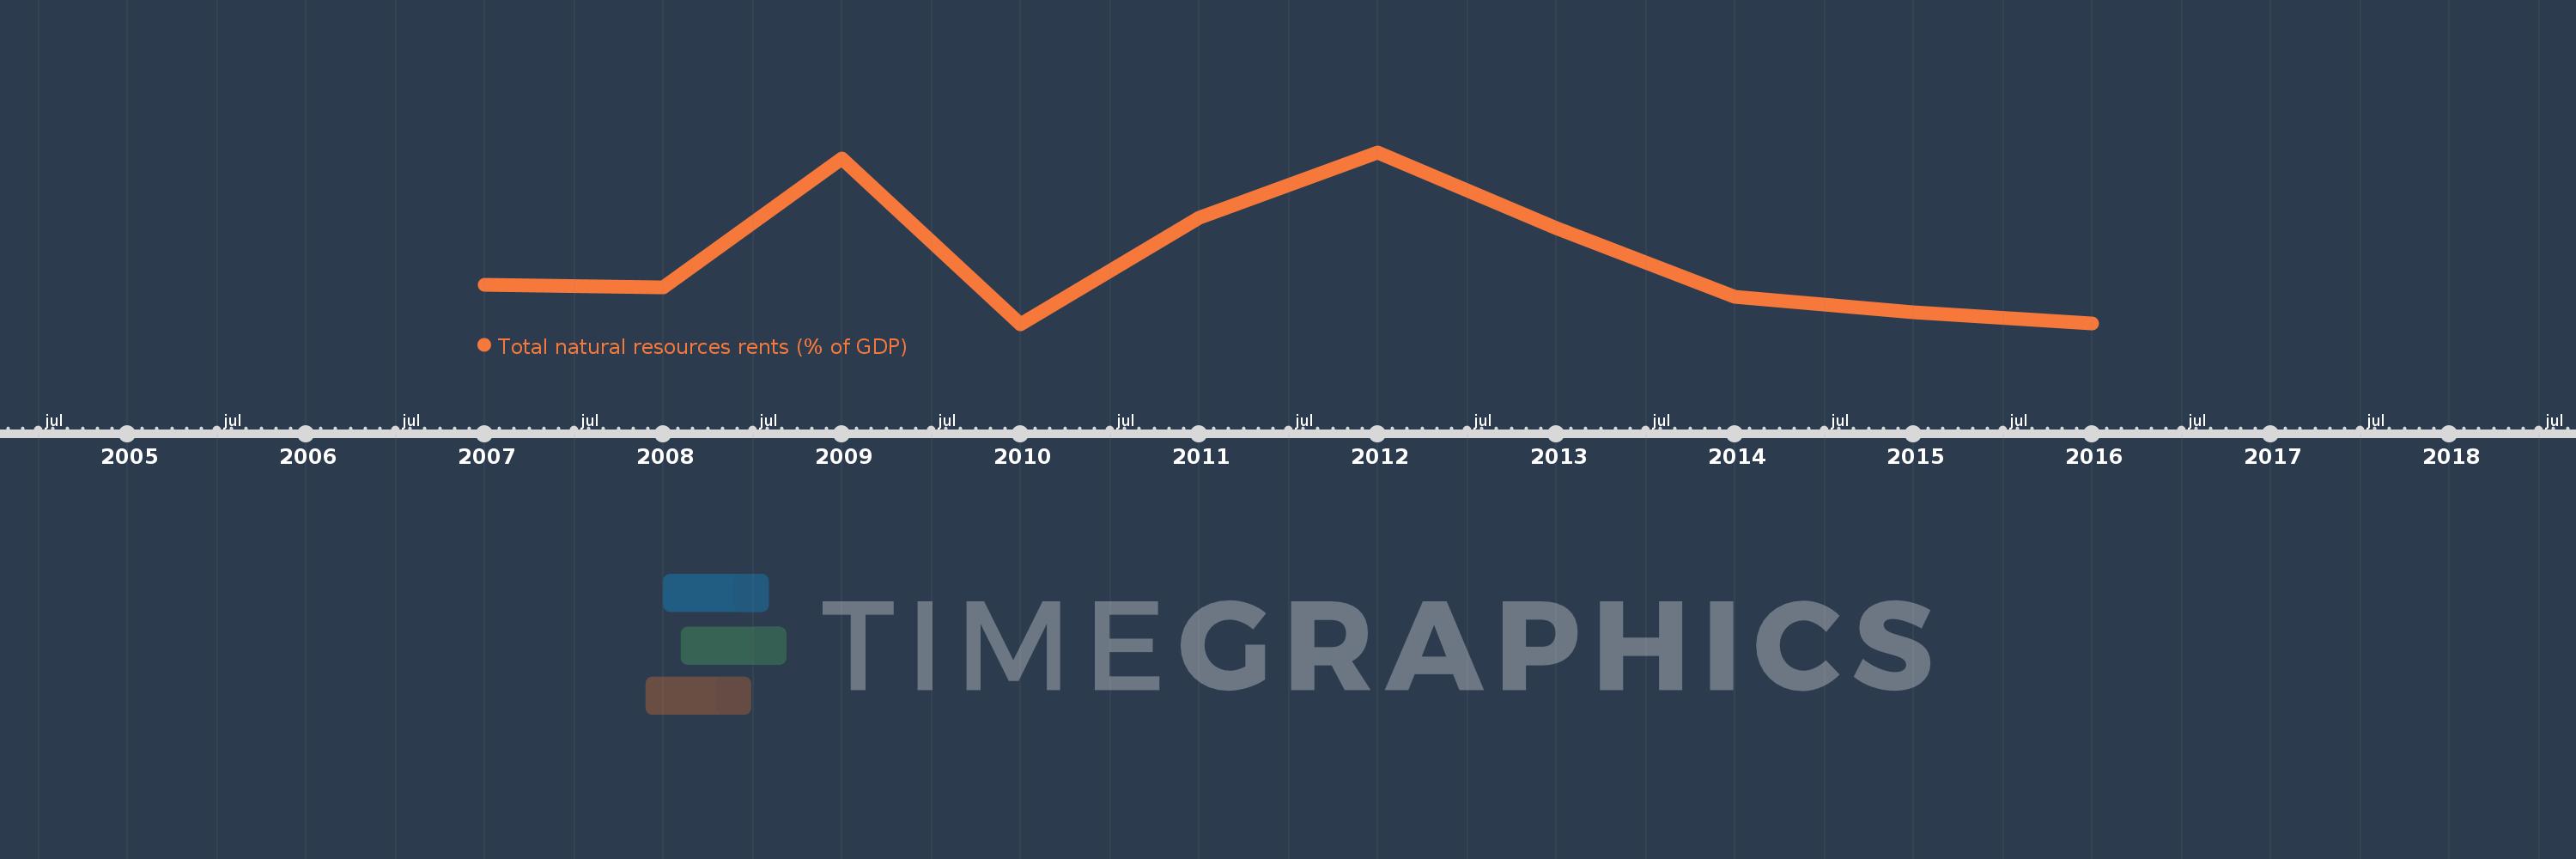
This timeline shows a graph from 2007 to 2016 of Serbia. No data until 2006. Number of actual observations by date: 10.
Source name:
World Development Indicators
Source organization:
Estimates based on sources and methods described in "The Changing Wealth of Nations: Measuring Sustainable Development in the New Millennium" (World Bank, 2011).
Categories, topics:
Energy & Mining, Environment
Last updated:
apr 23, 2017
Indicators value changes by year
Meaning:
1.87
Minimum:
1.208
jan 1, 2010
Maximum:
2.942
jan 1, 2012
At the date of observation
Value
Absolute change
Change from the previous value
jan 1, 2007
1.605
+1.605
0.0%
jan 1, 2008
1.584
-0.021
-1.32%
jan 1, 2009
2.878
+1.295
81.75%
jan 1, 2010
1.208
-1.67
-58.03%
jan 1, 2011
2.28
+1.072
88.72%
jan 1, 2012
2.942
+0.663
29.07%
jan 1, 2013
2.18
-0.762
-25.91%
jan 1, 2014
1.483
-0.697
-31.97%
jan 1, 2015
1.332
-0.151
-10.21%
jan 1, 2016
1.212
-0.12
-8.99%
Ranking of countries by current statistics by years