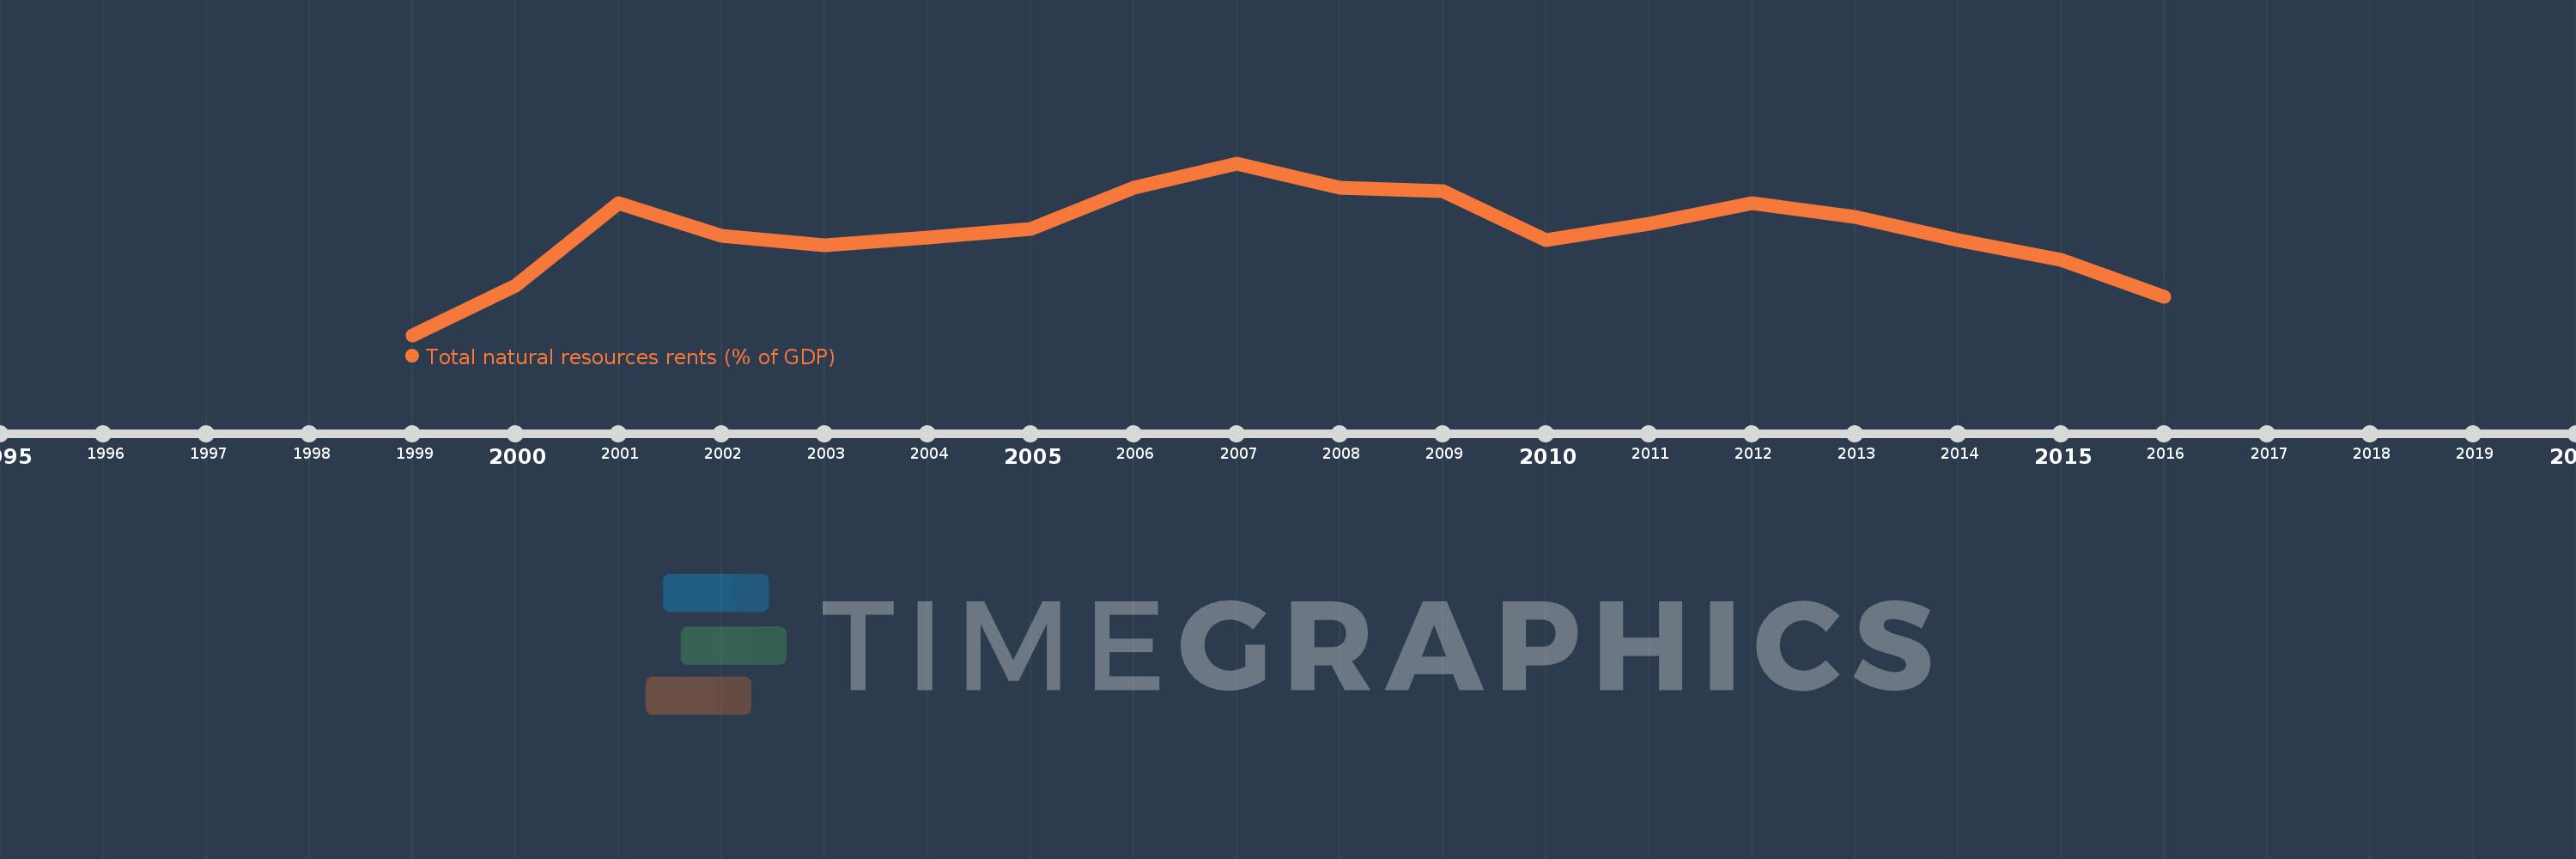
This timeline shows a graph from 1999 to 2016 of Azerbaijan. No data until 1998. Number of actual observations by date: 18.
Source name:
World Development Indicators
Source organization:
Estimates based on sources and methods described in "The Changing Wealth of Nations: Measuring Sustainable Development in the New Millennium" (World Bank, 2011).
Categories, topics:
Energy & Mining, Environment
Last updated:
apr 23, 2017
Indicators value changes by year
Meaning:
28.434
Minimum:
4.4
jan 1, 1999
Maximum:
44.58
jan 1, 2007
At the date of observation
Value
Absolute change
Change from the previous value
jan 1, 1999
4.4
+4.4
0.0%
jan 1, 2000
15.921
+11.521
261.87%
jan 1, 2001
35.327
+19.406
121.89%
jan 1, 2002
27.639
-7.688
-21.76%
jan 1, 2003
25.461
-2.178
-7.88%
jan 1, 2004
27.25
+1.789
7.03%
jan 1, 2005
29.179
+1.929
7.08%
jan 1, 2006
38.922
+9.743
33.39%
jan 1, 2007
44.58
+5.658
14.54%
jan 1, 2008
38.856
-5.724
-12.84%
jan 1, 2009
38.148
-0.707
-1.82%
jan 1, 2010
26.58
-11.568
-30.32%
jan 1, 2011
30.465
+3.884
14.61%
jan 1, 2012
35.144
+4.68
15.36%
jan 1, 2013
32.021
-3.124
-8.89%
jan 1, 2014
26.542
-5.479
-17.11%
jan 1, 2015
22.054
-4.488
-16.91%
jan 1, 2016
13.32
-8.734
-39.6%
Ranking of countries by current statistics by years