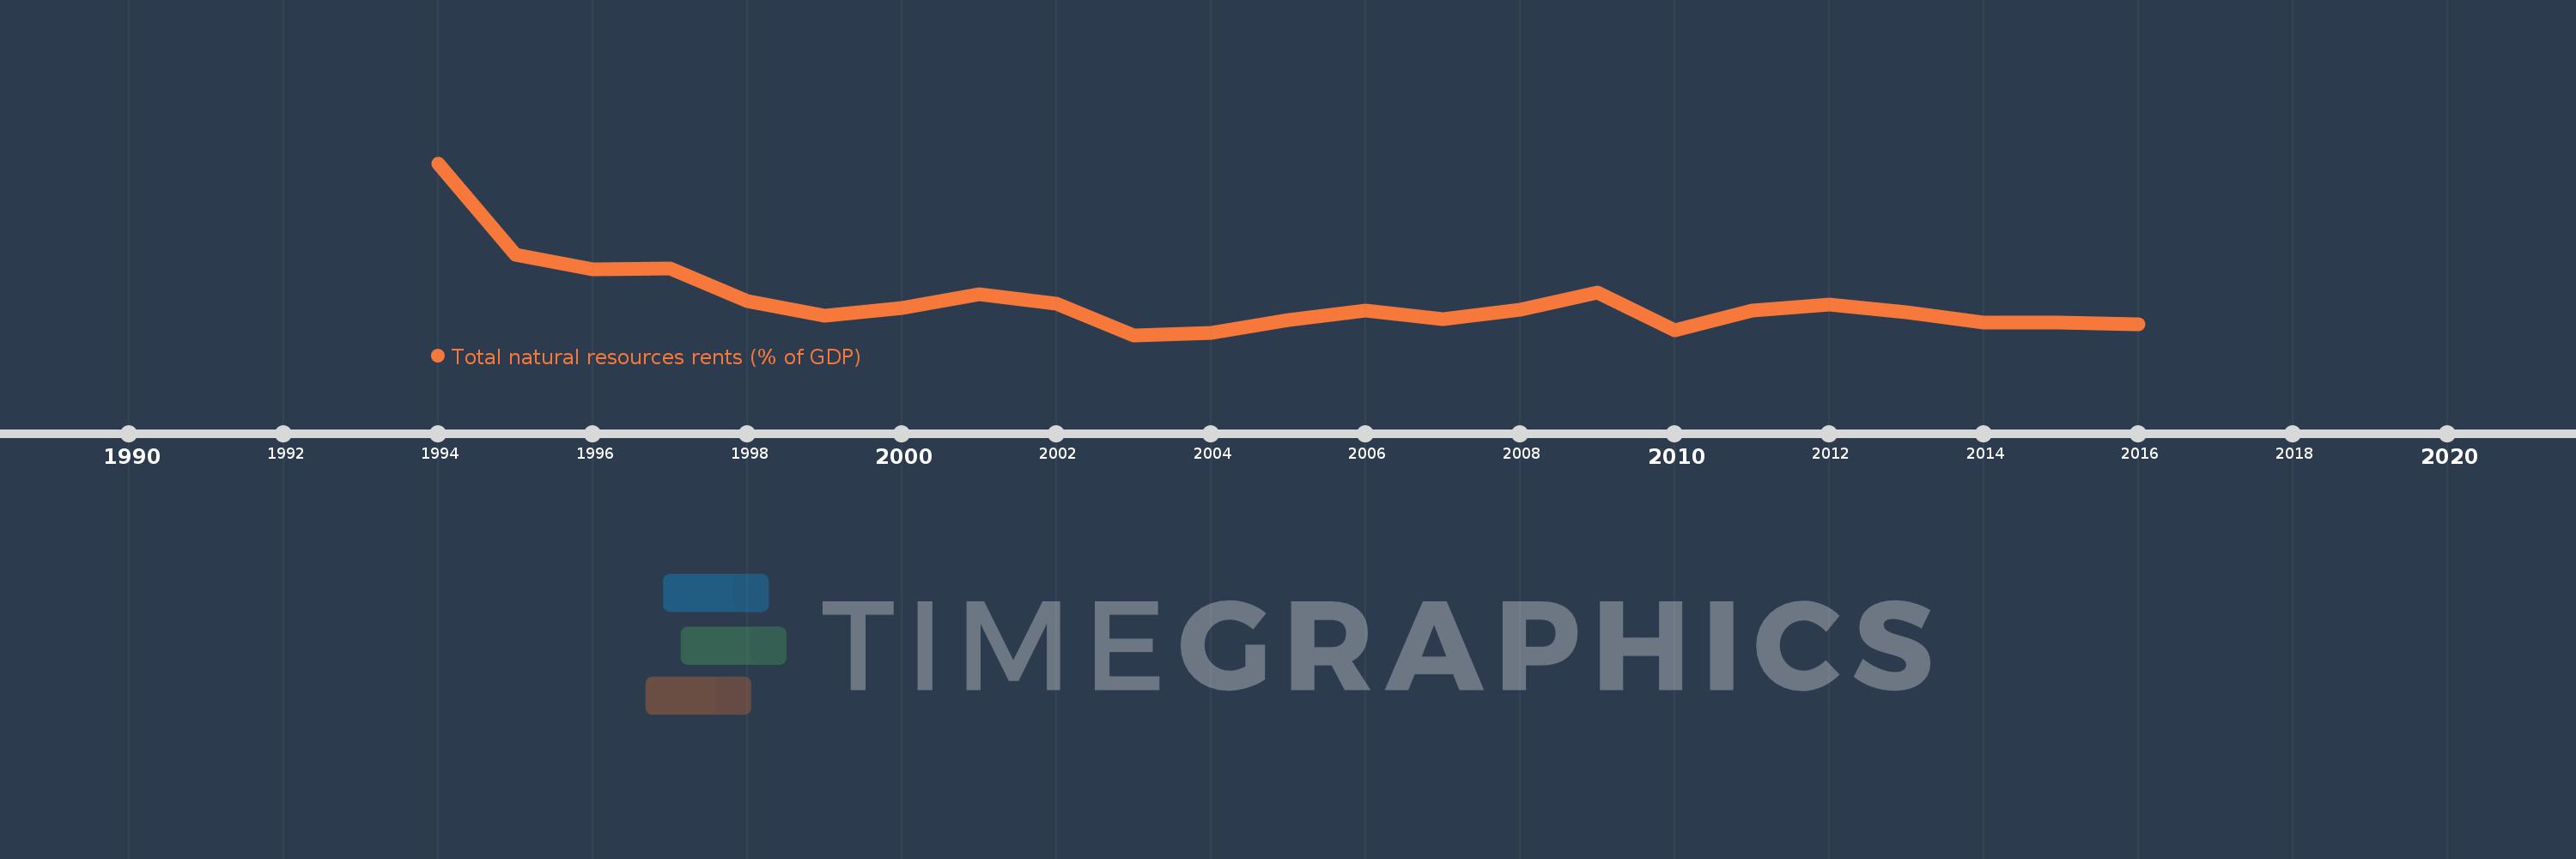
This timeline shows a graph from 1994 to 2016 of Slovak Republic. No data until 1993. Number of actual observations by date: 23.
Source name:
World Development Indicators
Source organization:
Estimates based on sources and methods described in "The Changing Wealth of Nations: Measuring Sustainable Development in the New Millennium" (World Bank, 2011).
Categories, topics:
Energy & Mining, Environment
Last updated:
apr 23, 2017
Indicators value changes by year
Meaning:
0.364
Minimum:
0.253
jan 1, 2003
Maximum:
0.817
jan 1, 1994
At the date of observation
Value
Absolute change
Change from the previous value
jan 1, 1994
0.817
+0.817
0.0%
jan 1, 1995
0.517
-0.3
-36.74%
jan 1, 1996
0.469
-0.048
-9.29%
jan 1, 1997
0.471
+0.003
0.58%
jan 1, 1998
0.365
-0.106
-22.49%
jan 1, 1999
0.317
-0.049
-13.34%
jan 1, 2000
0.341
+0.025
7.76%
jan 1, 2001
0.388
+0.047
13.66%
jan 1, 2002
0.355
-0.032
-8.36%
jan 1, 2003
0.253
-0.103
-28.97%
jan 1, 2004
0.259
+0.007
2.7%
jan 1, 2005
0.302
+0.043
16.43%
jan 1, 2006
0.333
+0.031
10.37%
jan 1, 2007
0.306
-0.027
-8.2%
jan 1, 2008
0.335
+0.029
9.58%
jan 1, 2009
0.394
+0.059
17.51%
jan 1, 2010
0.268
-0.126
-32.06%
jan 1, 2011
0.332
+0.064
23.9%
jan 1, 2012
0.354
+0.022
6.66%
jan 1, 2013
0.327
-0.027
-7.64%
jan 1, 2014
0.295
-0.032
-9.83%
jan 1, 2015
0.294
-0.001
-0.3%
jan 1, 2016
0.288
-0.006
-1.95%
Ranking of countries by current statistics by years