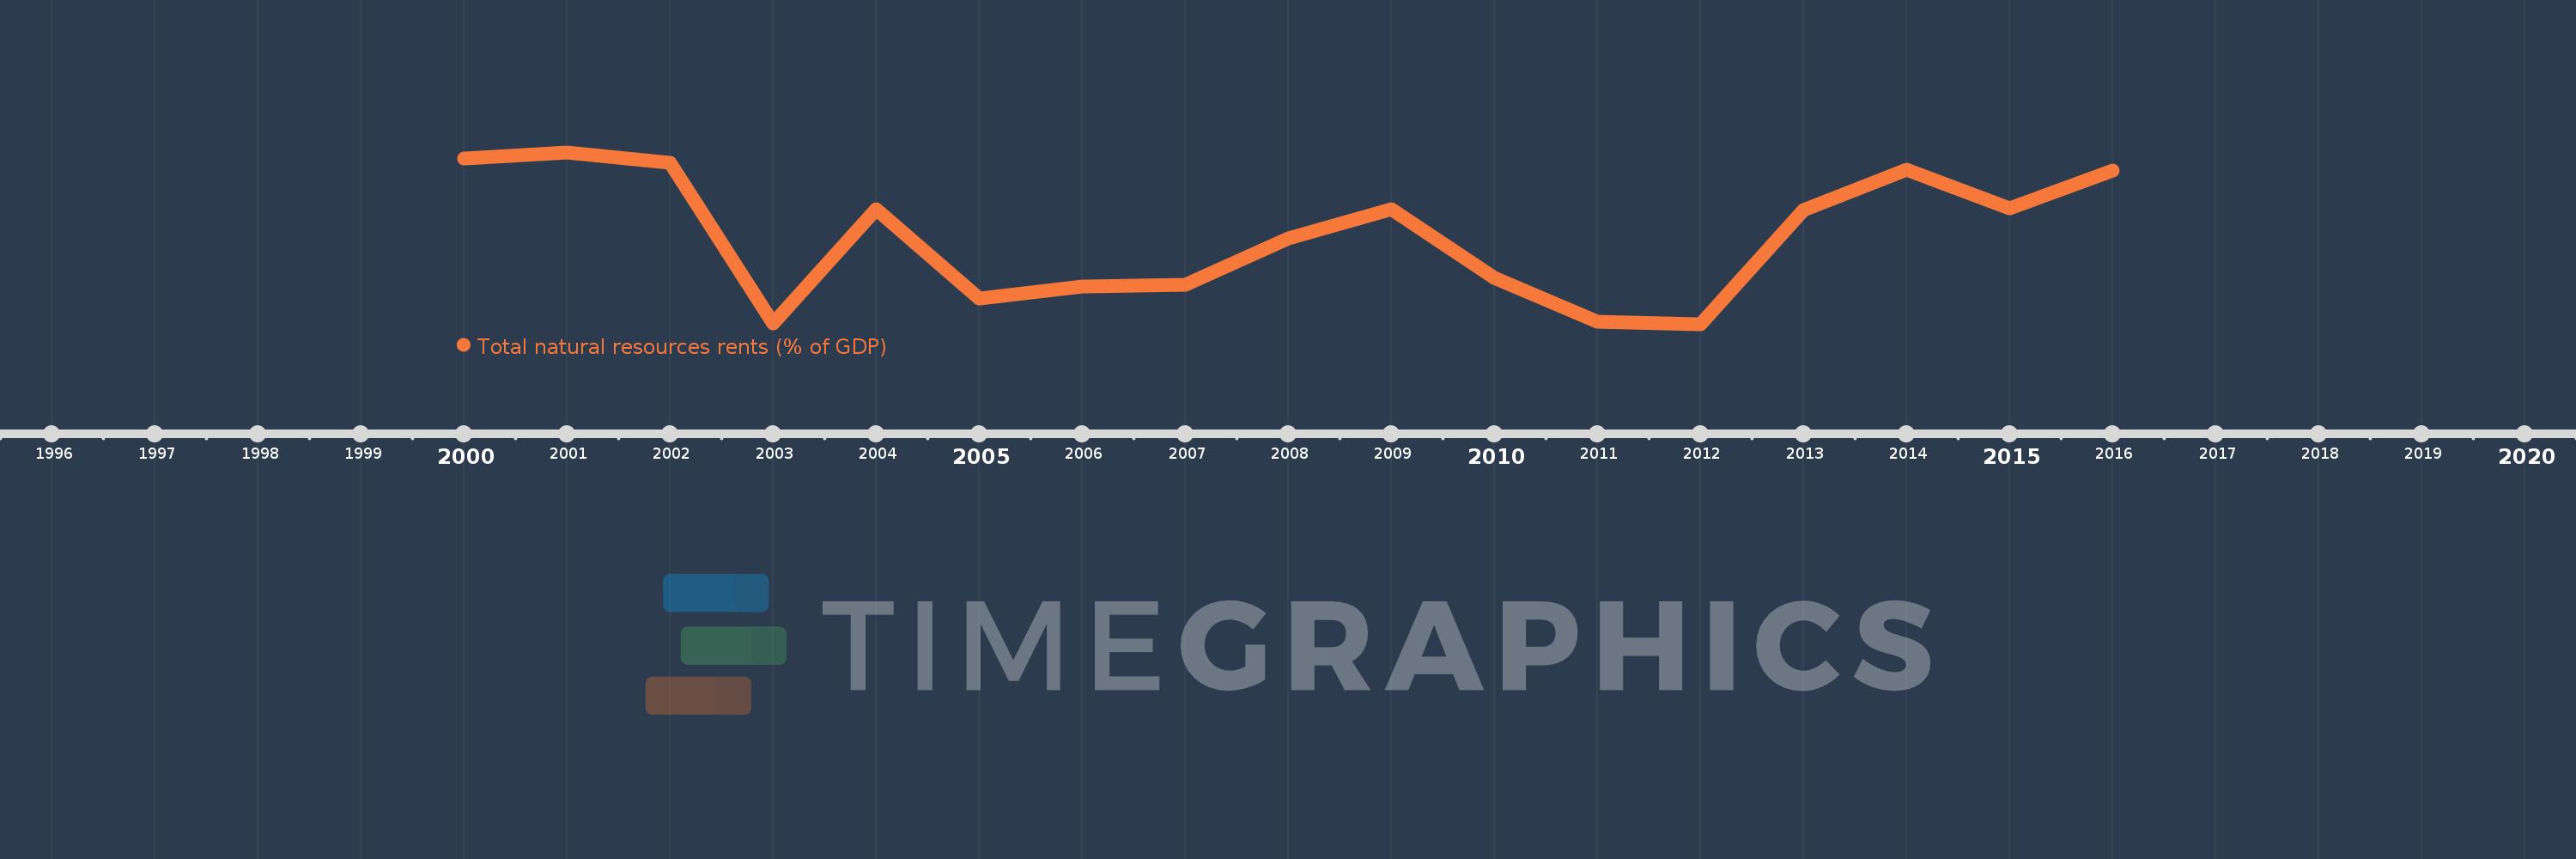
This timeline shows a graph from 2000 to 2016 of Malawi. No data until 1999. Number of actual observations by date: 17.
Source name:
World Development Indicators
Source organization:
Estimates based on sources and methods described in "The Changing Wealth of Nations: Measuring Sustainable Development in the New Millennium" (World Bank, 2011).
Categories, topics:
Energy & Mining, Environment
Last updated:
apr 23, 2017
Indicators value changes by year
Meaning:
7.95
Minimum:
5.708
jan 1, 2012
Maximum:
10.062
jan 1, 2001
At the date of observation
Value
Absolute change
Change from the previous value
jan 1, 2000
9.898
+9.898
0.0%
jan 1, 2001
10.062
+0.164
1.66%
jan 1, 2002
9.808
-0.254
-2.53%
jan 1, 2003
5.736
-4.072
-41.52%
jan 1, 2004
8.613
+2.878
50.17%
jan 1, 2005
6.356
-2.257
-26.21%
jan 1, 2006
6.657
+0.301
4.74%
jan 1, 2007
6.701
+0.044
0.66%
jan 1, 2008
7.873
+1.172
17.49%
jan 1, 2009
8.624
+0.751
9.54%
jan 1, 2010
6.88
-1.744
-20.22%
jan 1, 2011
5.769
-1.111
-16.15%
jan 1, 2012
5.708
-0.061
-1.06%
jan 1, 2013
8.594
+2.887
50.57%
jan 1, 2014
9.617
+1.023
11.9%
jan 1, 2015
8.645
-0.972
-10.11%
jan 1, 2016
9.61
+0.965
11.16%
Ranking of countries by current statistics by years