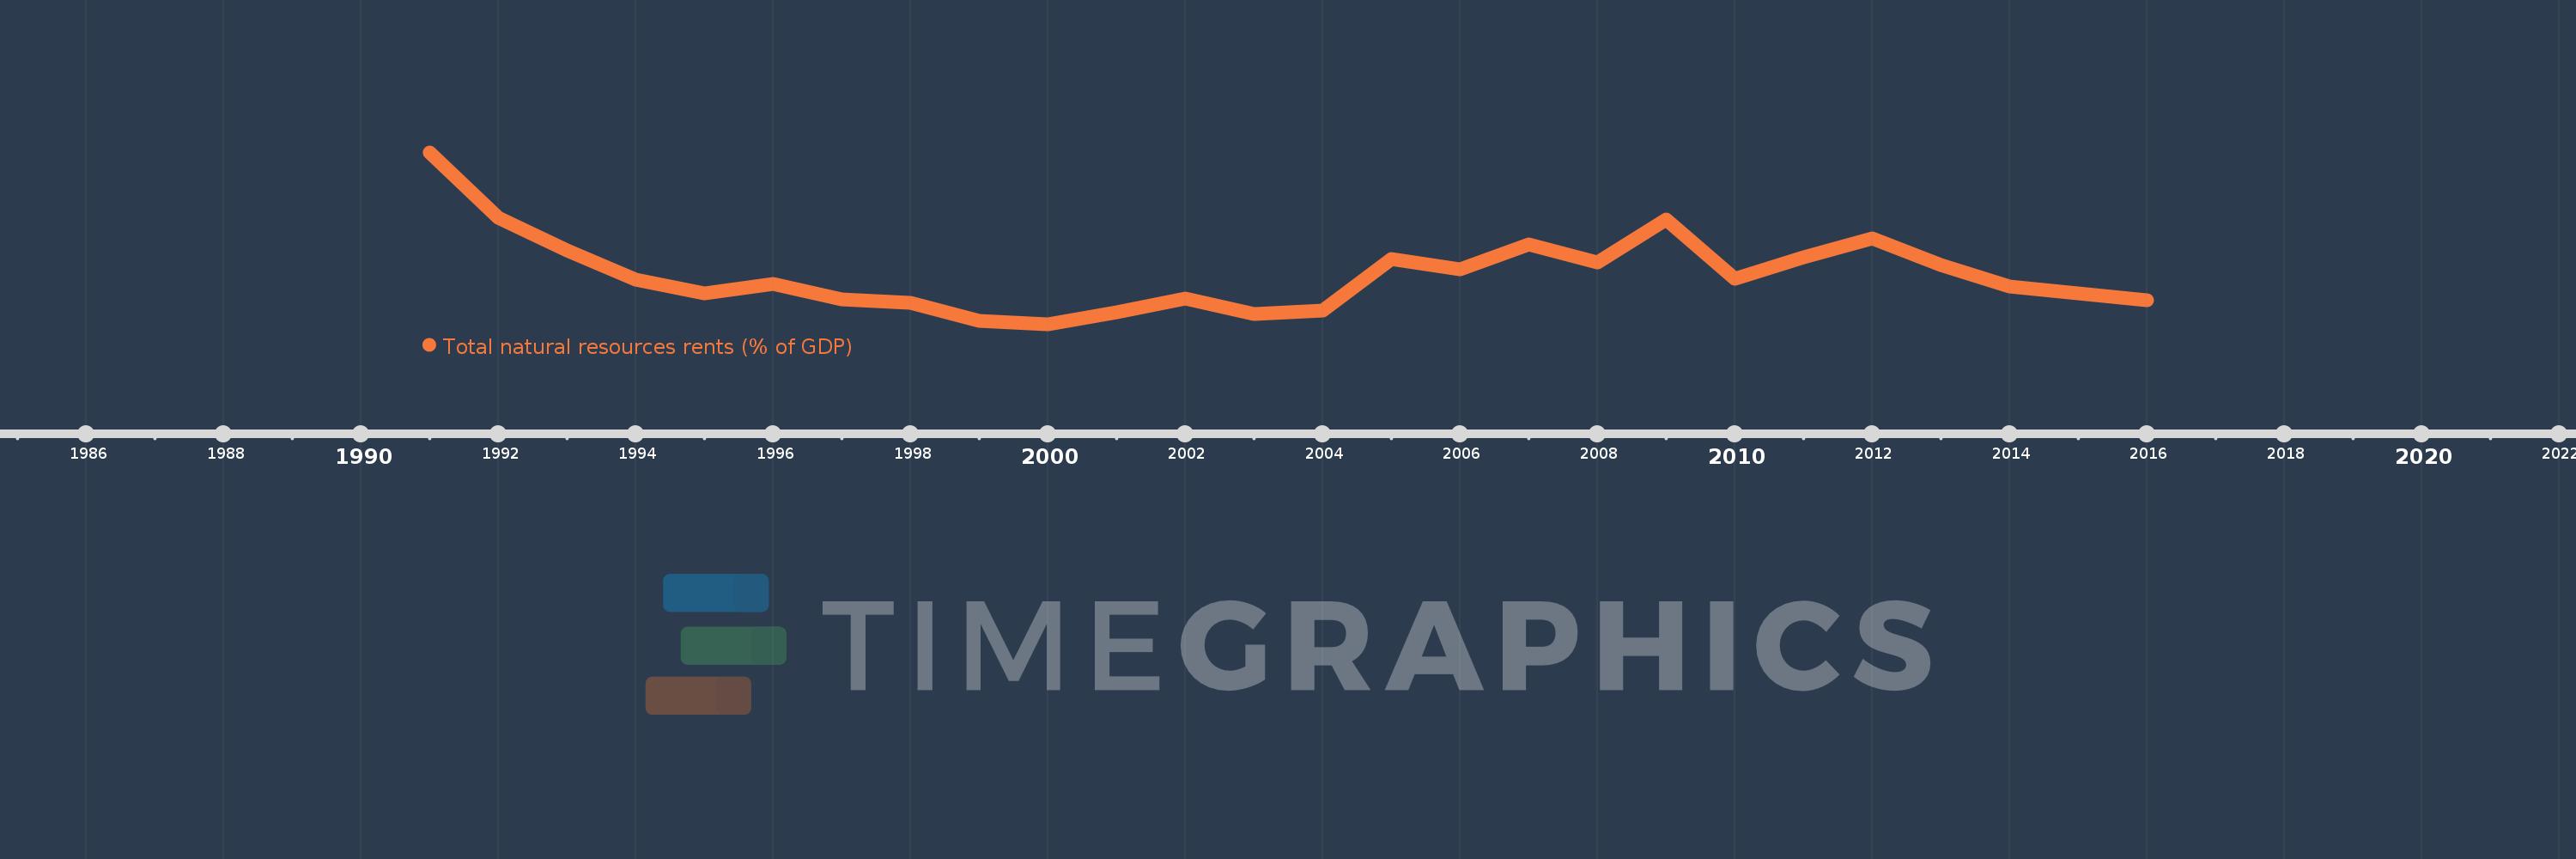
This timeline shows a graph from 1991 to 2016 of Poland. No data until 1990. Number of actual observations by date: 26.
Source name:
World Development Indicators
Source organization:
Estimates based on sources and methods described in "The Changing Wealth of Nations: Measuring Sustainable Development in the New Millennium" (World Bank, 2011).
Categories, topics:
Energy & Mining, Environment
Last updated:
apr 23, 2017
Indicators value changes by year
Meaning:
1.293
Minimum:
0.427
jan 1, 2000
Maximum:
3.41
jan 1, 1991
At the date of observation
Value
Absolute change
Change from the previous value
jan 1, 1991
3.41
+3.41
0.0%
jan 1, 1992
2.272
-1.138
-33.36%
jan 1, 1993
1.715
-0.558
-24.54%
jan 1, 1994
1.202
-0.512
-29.87%
jan 1, 1995
0.968
-0.234
-19.47%
jan 1, 1996
1.132
+0.164
16.91%
jan 1, 1997
0.856
-0.276
-24.41%
jan 1, 1998
0.801
-0.054
-6.37%
jan 1, 1999
0.491
-0.31
-38.75%
jan 1, 2000
0.427
-0.063
-12.89%
jan 1, 2001
0.641
+0.214
49.96%
jan 1, 2002
0.874
+0.233
36.33%
jan 1, 2003
0.602
-0.272
-31.16%
jan 1, 2004
0.657
+0.056
9.29%
jan 1, 2005
1.552
+0.895
136.08%
jan 1, 2006
1.376
-0.176
-11.35%
jan 1, 2007
1.806
+0.43
31.25%
jan 1, 2008
1.505
-0.301
-16.67%
jan 1, 2009
2.244
+0.739
49.07%
jan 1, 2010
1.218
-1.026
-45.72%
jan 1, 2011
1.586
+0.368
30.25%
jan 1, 2012
1.924
+0.338
21.32%
jan 1, 2013
1.457
-0.467
-24.26%
jan 1, 2014
1.077
-0.38
-26.09%
jan 1, 2015
0.964
-0.113
-10.53%
jan 1, 2016
0.85
-0.114
-11.78%
Ranking of countries by current statistics by years