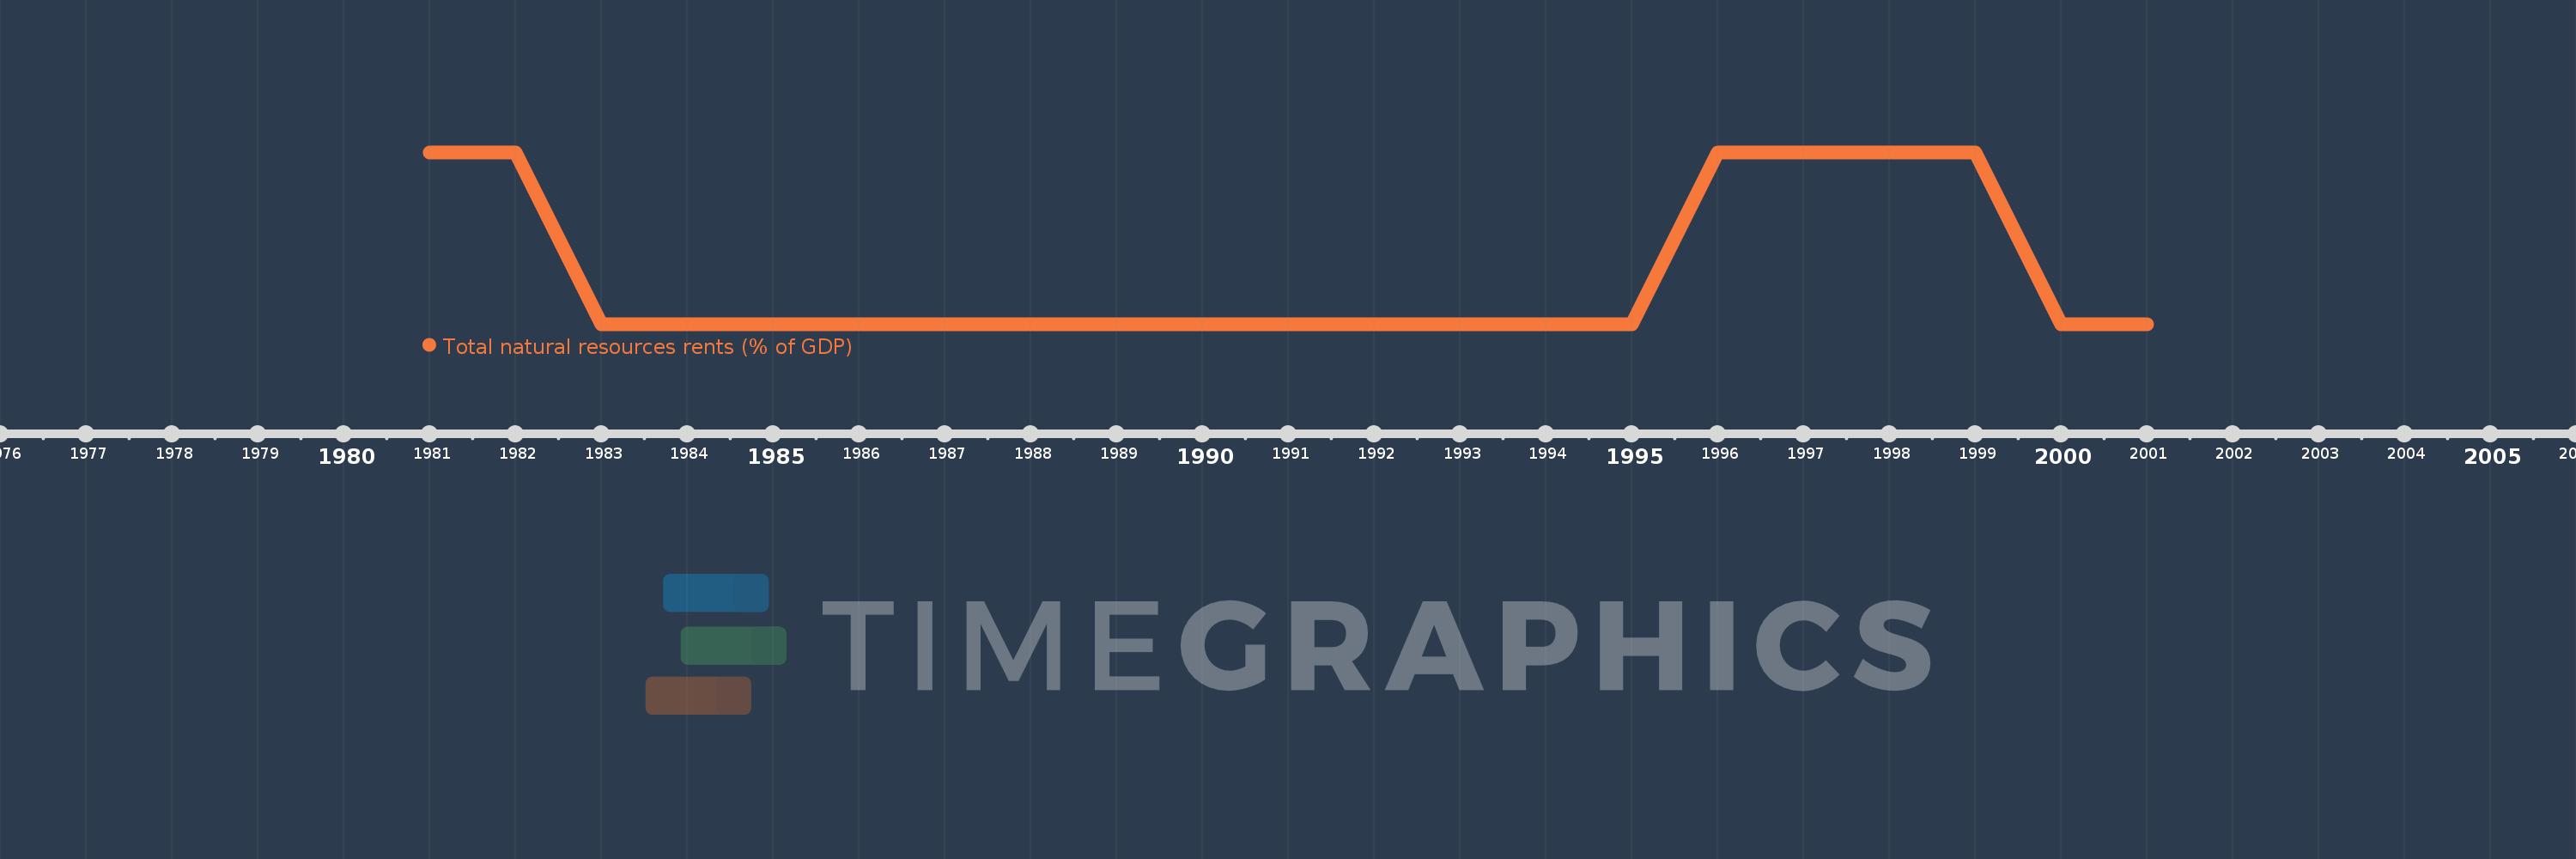
This timeline shows a graph from 1981 to 2001 of French Polynesia. No data until 1980. Number of actual observations by date: 21.
Source name:
World Development Indicators
Source organization:
Estimates based on sources and methods described in "The Changing Wealth of Nations: Measuring Sustainable Development in the New Millennium" (World Bank, 2011).
Categories, topics:
Energy & Mining, Environment
Last updated:
apr 23, 2017
Indicators value changes by year
Meaning:
0.001
Minimum:
0.001
jan 1, 1991
Maximum:
0.002
jan 1, 1981
At the date of observation
Value
Absolute change
Change from the previous value
jan 1, 1981
0.002
+0.002
0.0%
jan 1, 1982
0.002
-0.001
-32.1%
jan 1, 1983
0.001
0.0
-11.59%
jan 1, 1984
0.001
0.0
-0.14%
jan 1, 1985
0.001
0.0
-24.26%
jan 1, 1986
0.001
0.0
-8.35%
jan 1, 1987
0.001
+0.0
7.11%
jan 1, 1988
0.001
0.0
-7.52%
jan 1, 1989
0.001
0.0
-3.06%
jan 1, 1990
0.001
+0.0
4.36%
jan 1, 1991
0.001
0.0
-15.65%
jan 1, 1992
0.001
+0.0
11.79%
jan 1, 1993
0.001
+0.0
27.28%
jan 1, 1994
0.001
0.0
-21.05%
jan 1, 1995
0.001
+0.0
42.64%
jan 1, 1996
0.002
+0.001
48.65%
jan 1, 1997
0.002
+0.0
8.41%
jan 1, 1998
0.002
0.0
-1.23%
jan 1, 1999
0.002
0.0
-22.05%
jan 1, 2000
0.001
-0.001
-45.88%
jan 1, 2001
0.001
+0.0
9.85%
Ranking of countries by current statistics by years