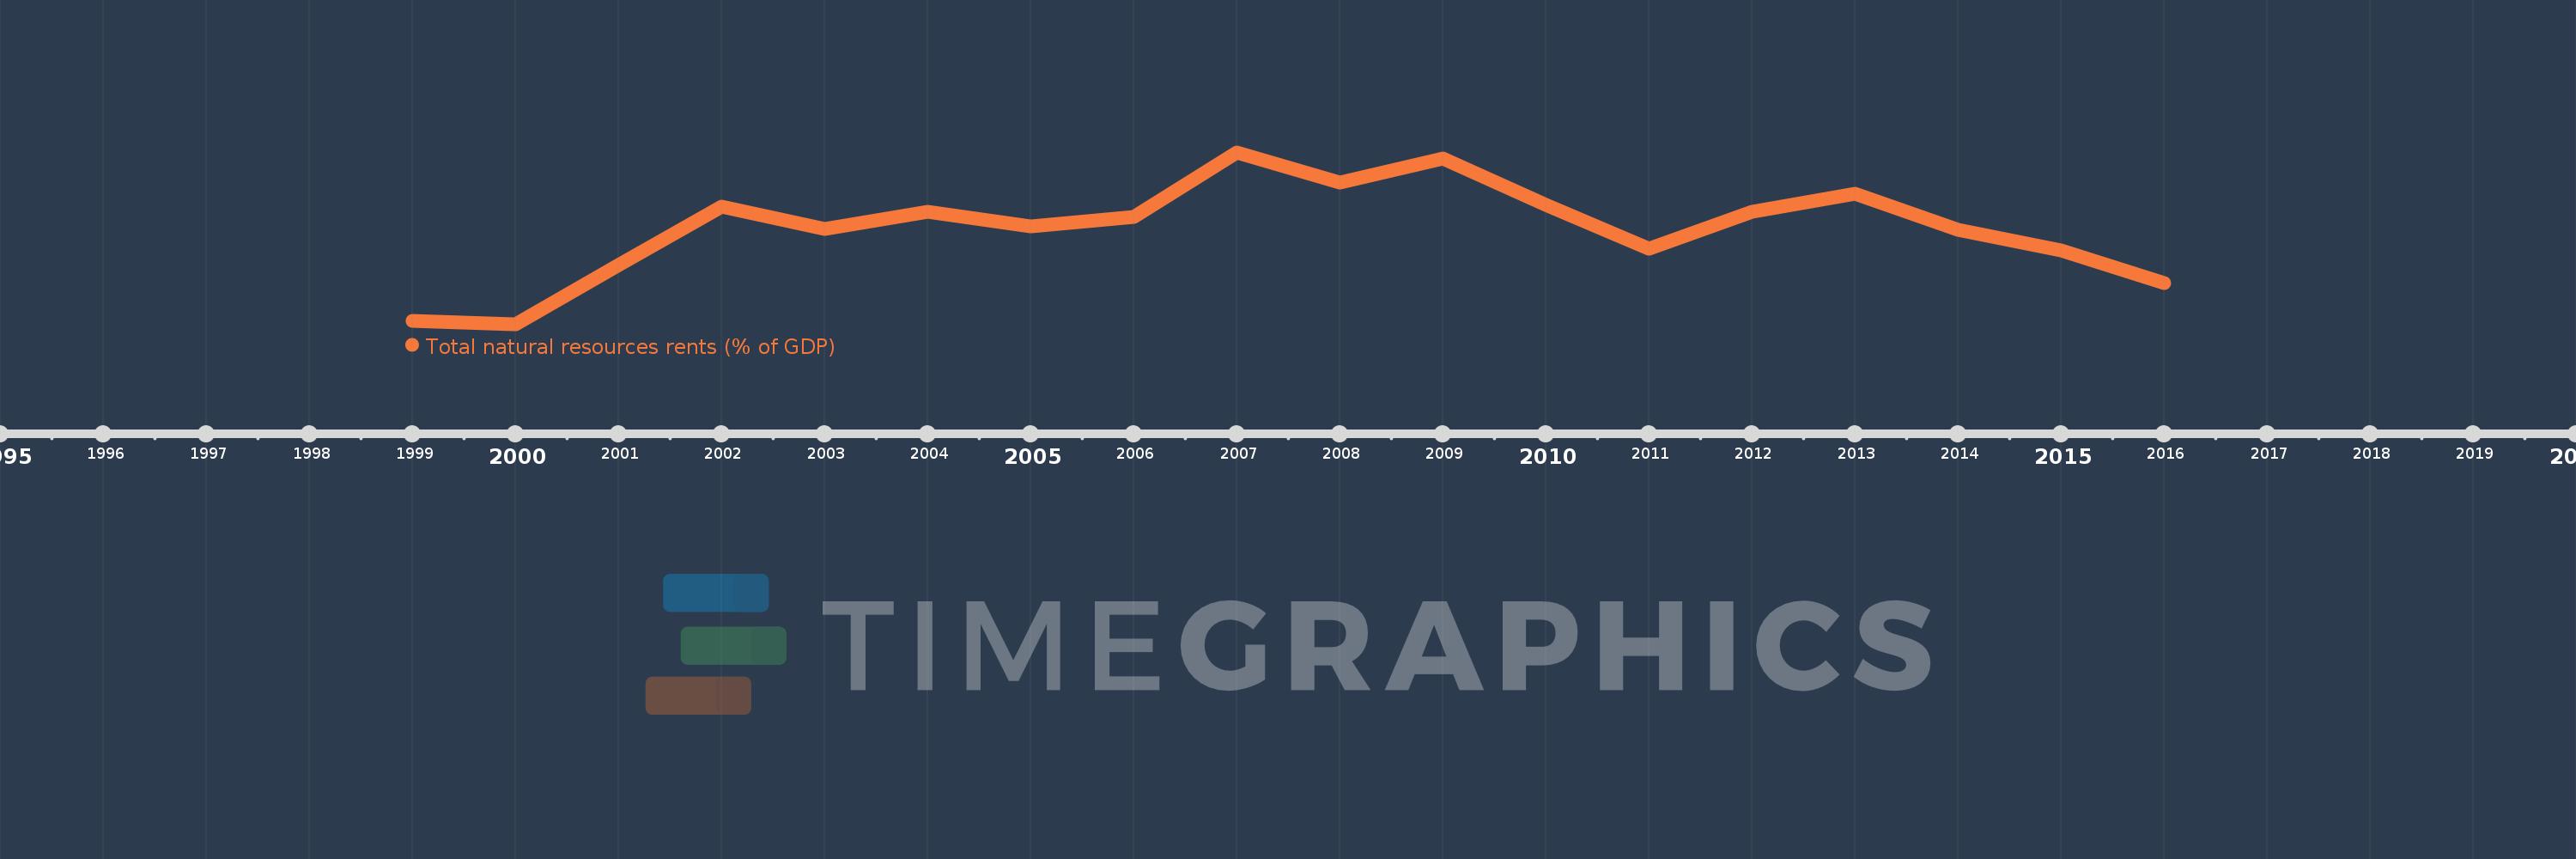
This timeline shows a graph from 1999 to 2016 of Uzbekistan. No data until 1998. Number of actual observations by date: 18.
Source name:
World Development Indicators
Source organization:
Estimates based on sources and methods described in "The Changing Wealth of Nations: Measuring Sustainable Development in the New Millennium" (World Bank, 2011).
Categories, topics:
Energy & Mining, Environment
Last updated:
apr 23, 2017
Indicators value changes by year
Meaning:
17.295
Minimum:
3.408
jan 1, 2000
Maximum:
28.384
jan 1, 2007
At the date of observation
Value
Absolute change
Change from the previous value
jan 1, 1999
3.931
+3.931
0.0%
jan 1, 2000
3.408
-0.523
-13.31%
jan 1, 2001
12.058
+8.65
253.82%
jan 1, 2002
20.474
+8.416
69.79%
jan 1, 2003
17.297
-3.177
-15.52%
jan 1, 2004
19.816
+2.519
14.57%
jan 1, 2005
17.67
-2.146
-10.83%
jan 1, 2006
18.97
+1.3
7.36%
jan 1, 2007
28.384
+9.414
49.63%
jan 1, 2008
23.984
-4.401
-15.5%
jan 1, 2009
27.436
+3.452
14.39%
jan 1, 2010
20.742
-6.693
-24.4%
jan 1, 2011
14.395
-6.347
-30.6%
jan 1, 2012
19.757
+5.361
37.24%
jan 1, 2013
22.371
+2.614
13.23%
jan 1, 2014
17.15
-5.221
-23.34%
jan 1, 2015
14.103
-3.047
-17.77%
jan 1, 2016
9.369
-4.734
-33.56%
Ranking of countries by current statistics by years