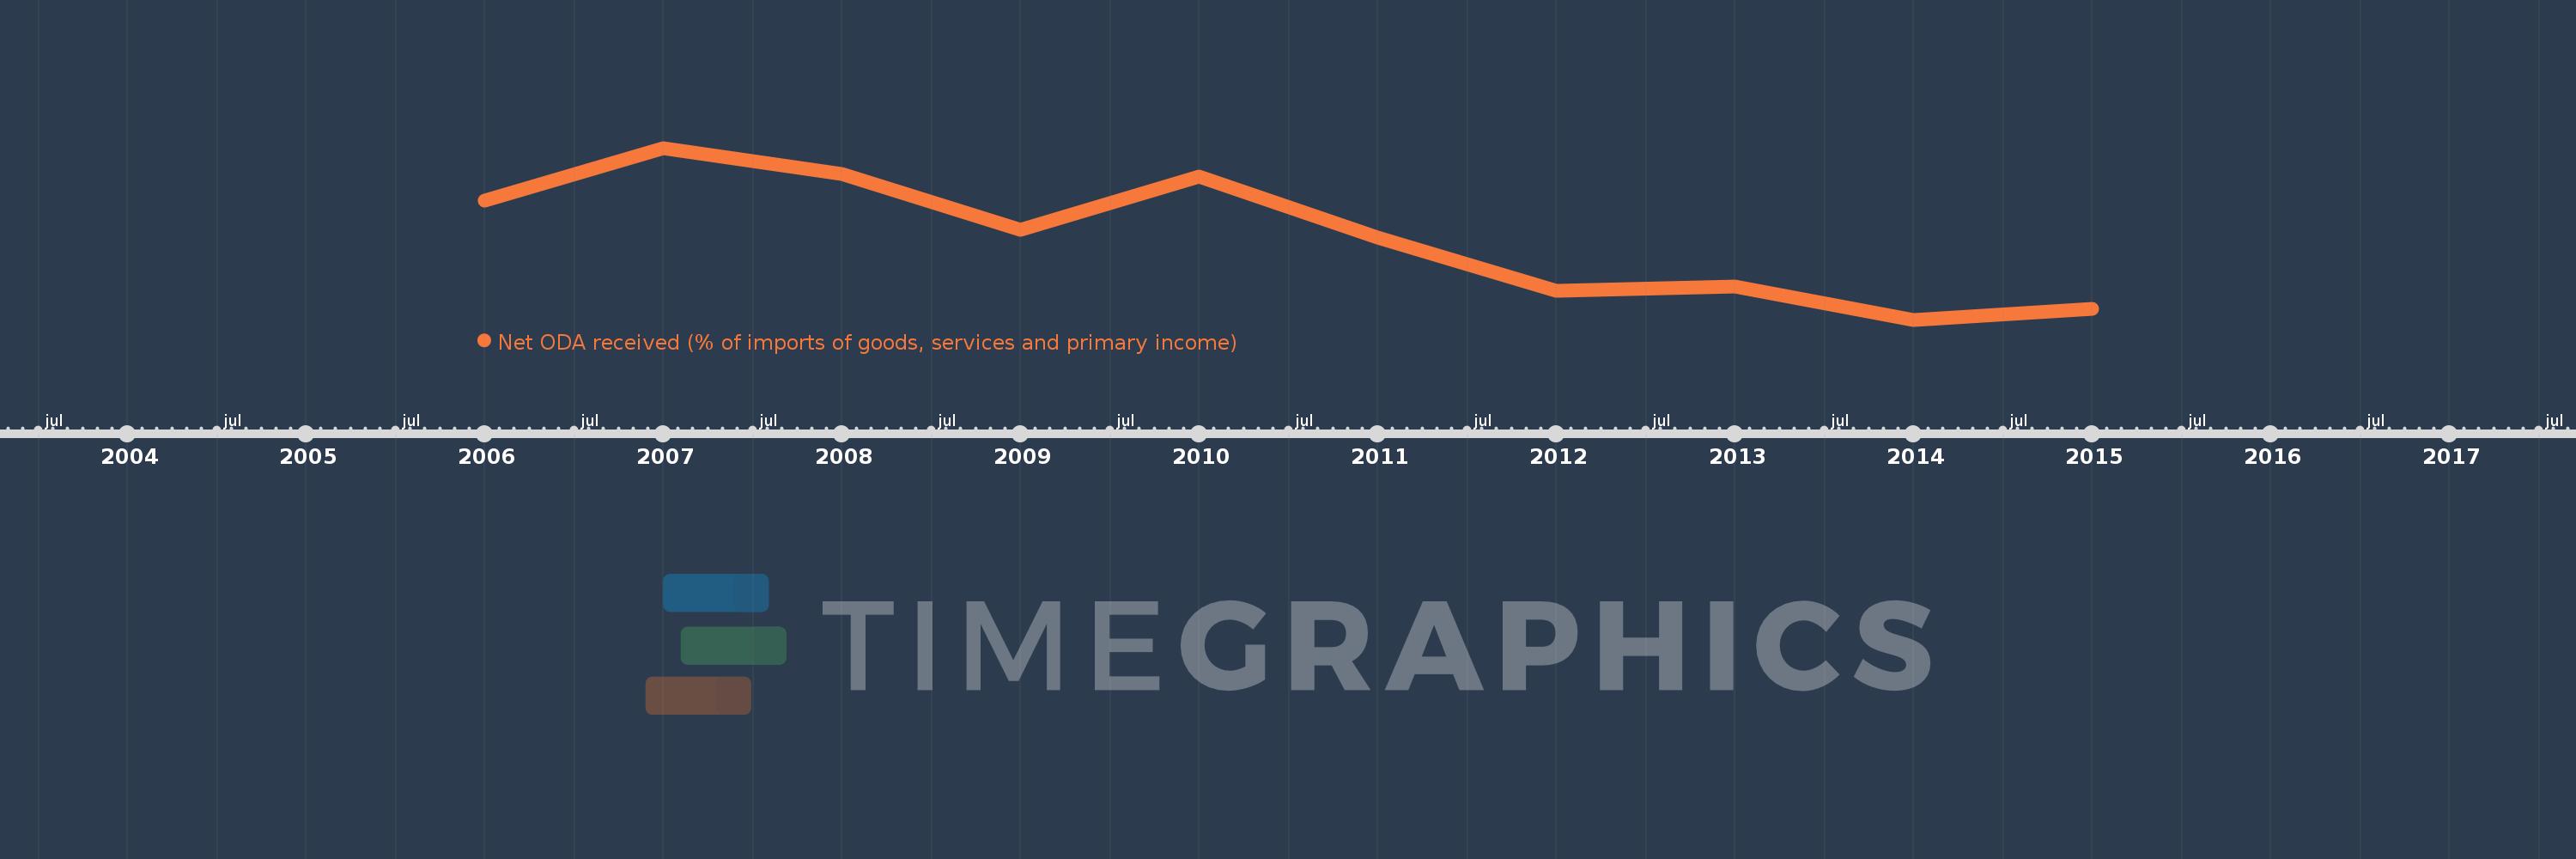
This timeline shows a graph from 2006 to 2015 of Burkina Faso. No data until 2005. Number of actual observations by date: 10.
Source name:
World Development Indicators
Source organization:
Development Assistance Committee of the Organisation for Economic Co-operation and Development, Geographical Distribution of Financial Flows to Developing Countries, Development Co-operation Report, and International Development Statistics database. Data are available online at: www.oecd.org/dac/stats/idsonline. World Bank imports of good and services estimates are used for the denominator.
Categories, topics:
Aid Effectiveness
Last updated:
apr 23, 2017
Indicators value changes by year
Meaning:
39.373
Minimum:
20.608
jan 1, 2014
Maximum:
59.645
jan 1, 2007
At the date of observation
Value
Absolute change
Change from the previous value
jan 1, 2006
47.745
+47.745
0.0%
jan 1, 2007
59.645
+11.9
24.93%
jan 1, 2008
53.78
-5.865
-9.83%
jan 1, 2009
41.005
-12.775
-23.75%
jan 1, 2010
53.177
+12.173
29.69%
jan 1, 2011
39.335
-13.843
-26.03%
jan 1, 2012
27.14
-12.195
-31.0%
jan 1, 2013
28.168
+1.029
3.79%
jan 1, 2014
20.608
-7.561
-26.84%
jan 1, 2015
23.131
+2.523
12.24%
Ranking of countries by current statistics by years