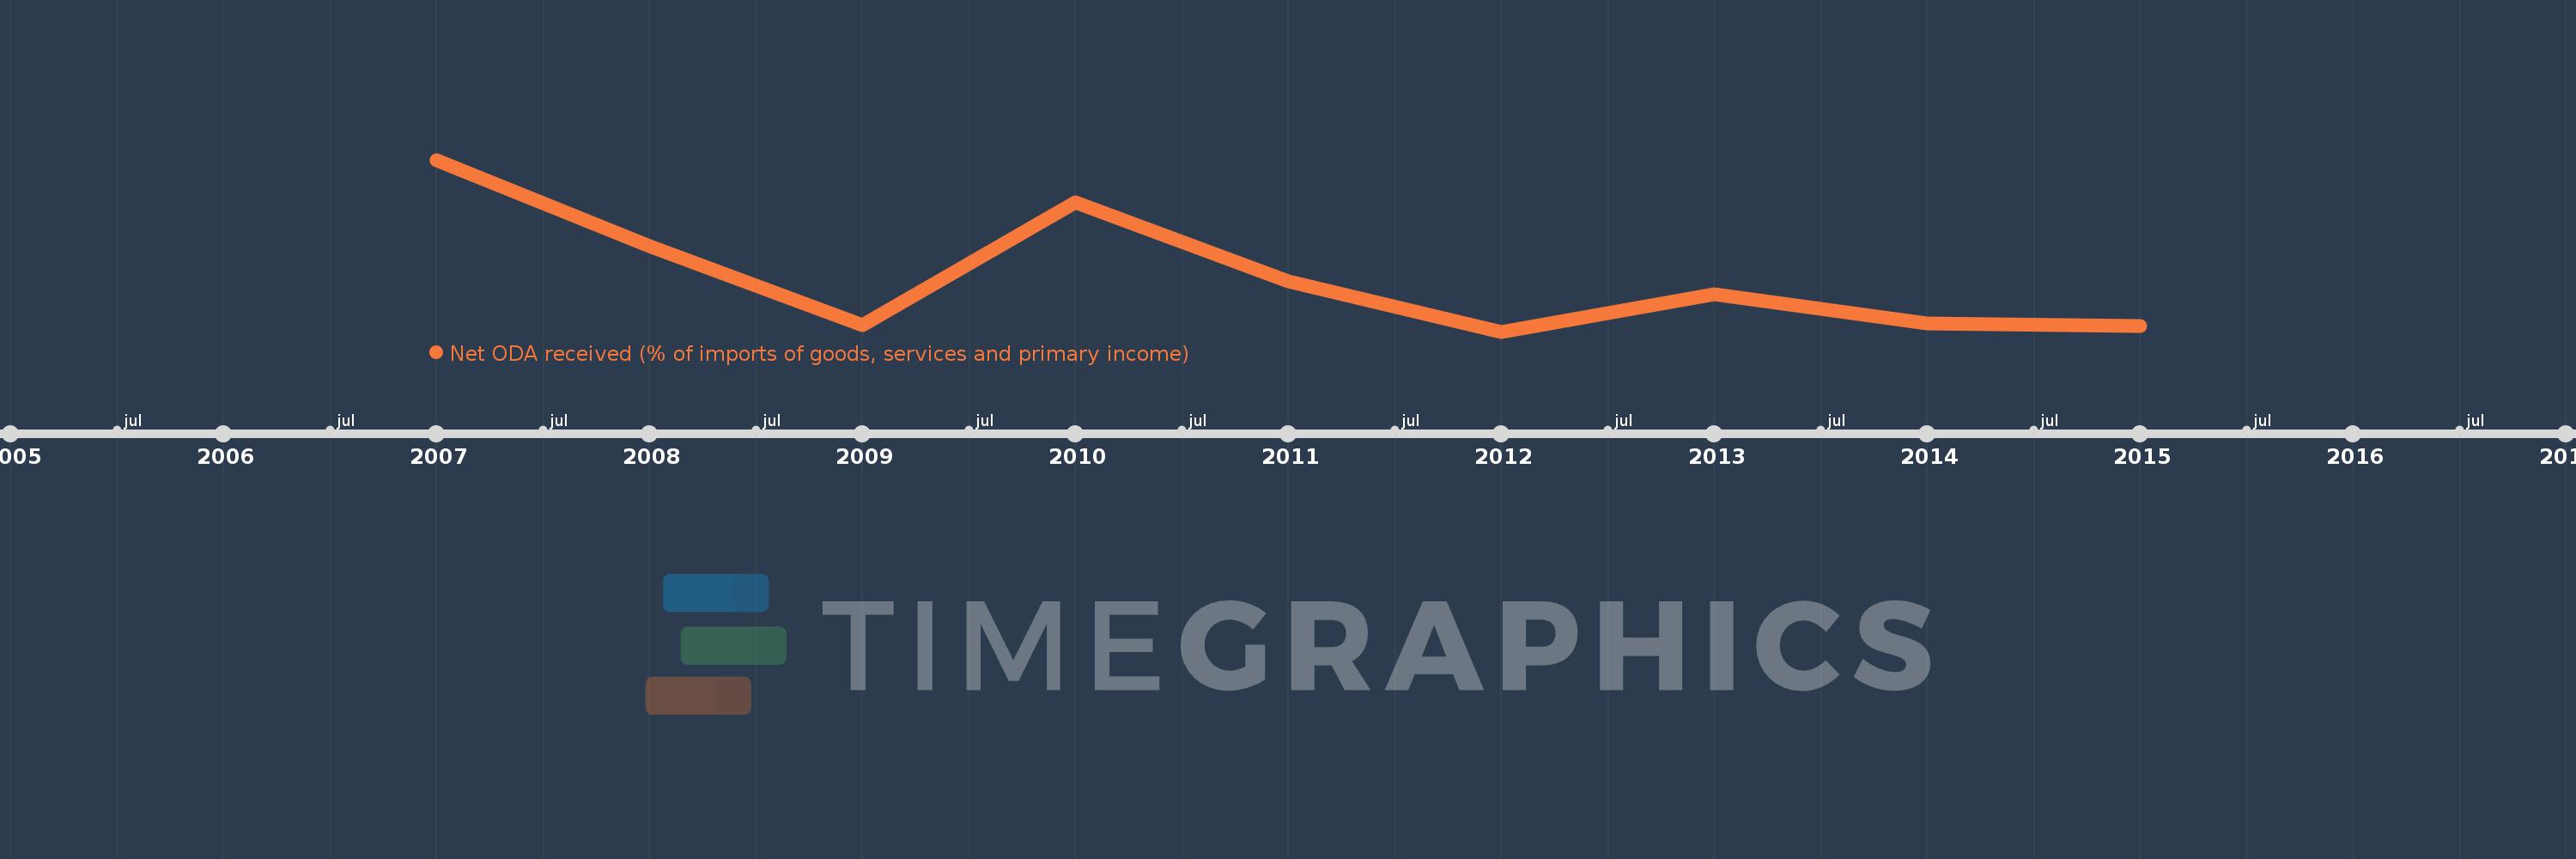
This timeline shows a graph from 2007 to 2015 of Bhutan. No data until 2006. Number of actual observations by date: 9.
Source name:
World Development Indicators
Source organization:
Development Assistance Committee of the Organisation for Economic Co-operation and Development, Geographical Distribution of Financial Flows to Developing Countries, Development Co-operation Report, and International Development Statistics database. Data are available online at: www.oecd.org/dac/stats/idsonline. World Bank imports of good and services estimates are used for the denominator.
Categories, topics:
Aid Effectiveness
Last updated:
apr 23, 2017
Indicators value changes by year
Meaning:
12.998
Minimum:
10.006
jan 1, 2012
Maximum:
19.357
jan 1, 2007
At the date of observation
Value
Absolute change
Change from the previous value
jan 1, 2007
19.357
+19.357
0.0%
jan 1, 2008
14.654
-4.703
-24.3%
jan 1, 2009
10.359
-4.295
-29.31%
jan 1, 2010
17.061
+6.701
64.69%
jan 1, 2011
12.747
-4.314
-25.29%
jan 1, 2012
10.006
-2.741
-21.5%
jan 1, 2013
12.034
+2.028
20.27%
jan 1, 2014
10.46
-1.574
-13.08%
jan 1, 2015
10.306
-0.154
-1.48%
Ranking of countries by current statistics by years