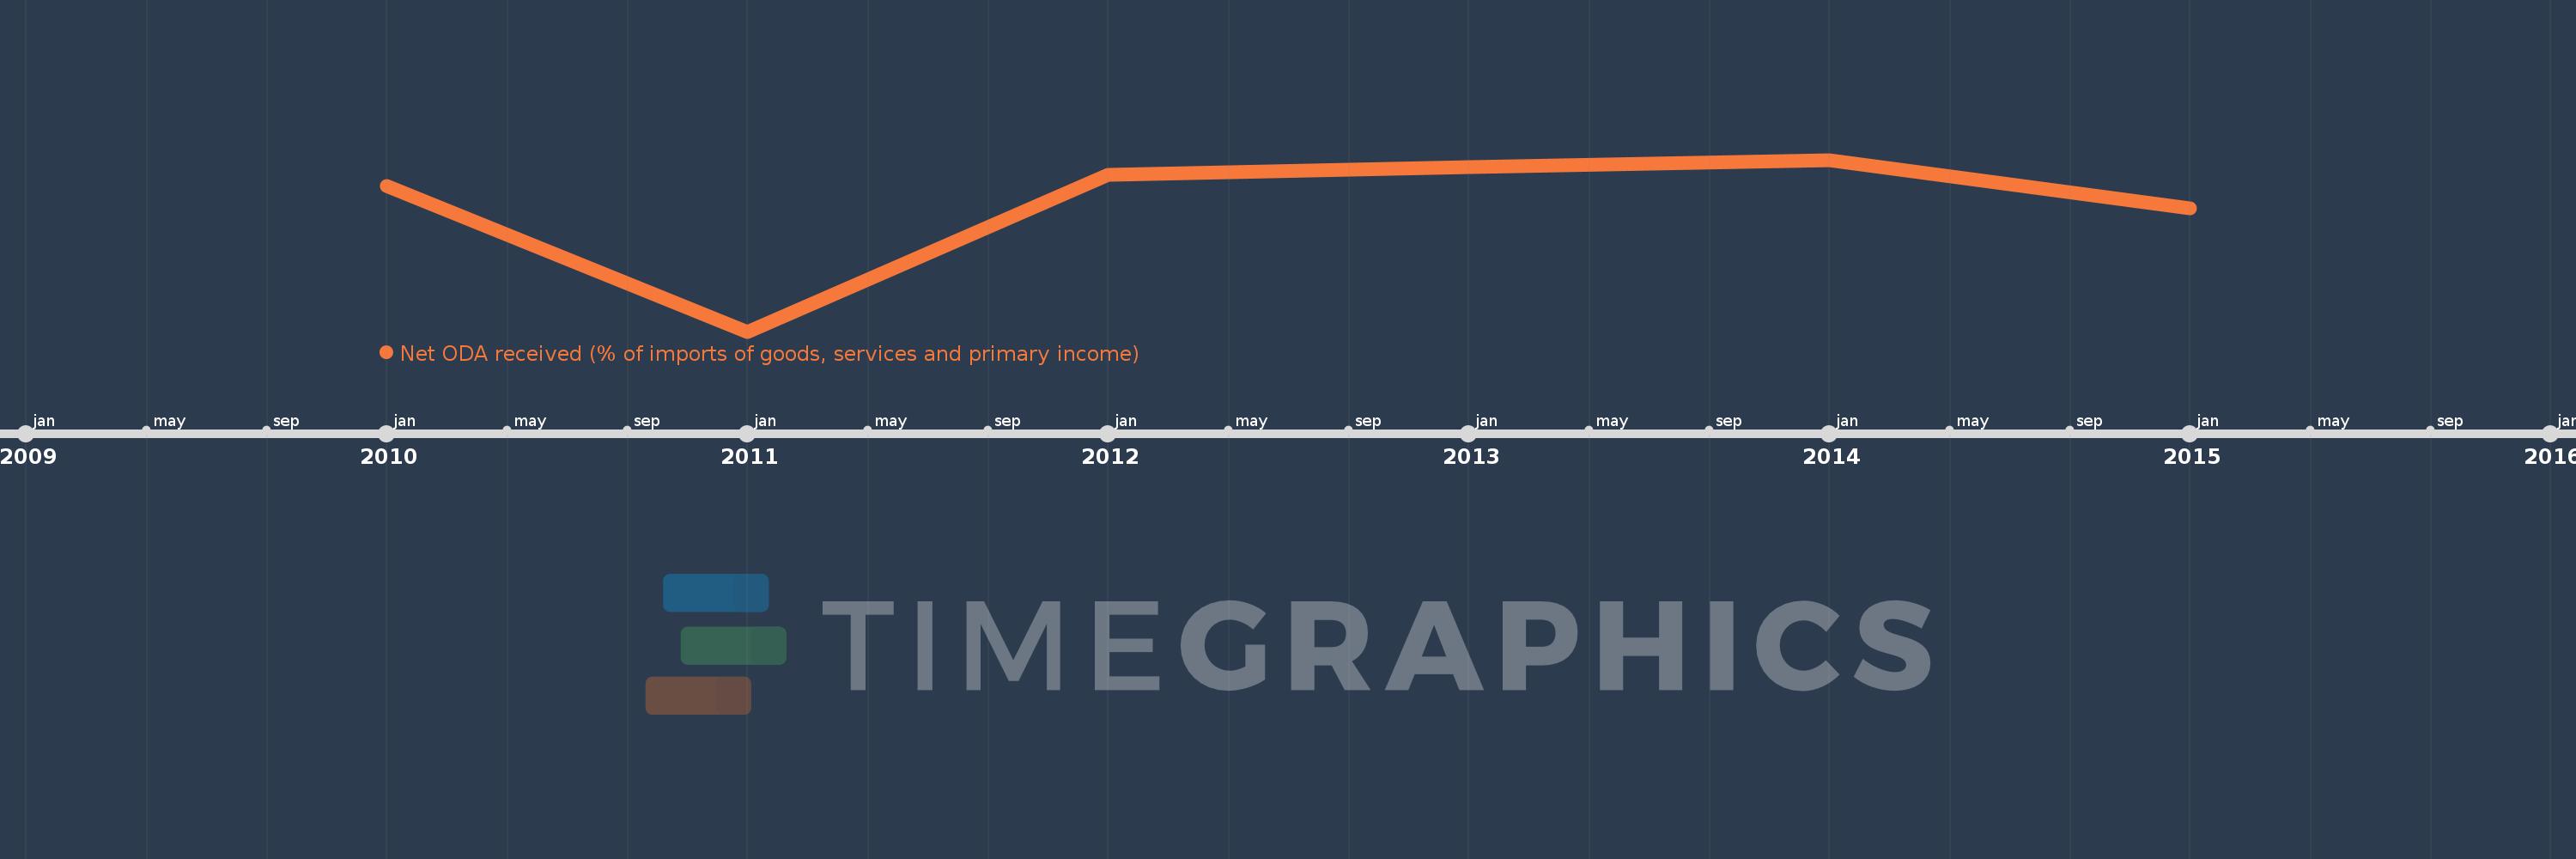
This timeline shows a graph from 2010 to 2015 of Micronesia, Fed. Sts.. No data until 2009. Number of actual observations by date: 6.
Source name:
World Development Indicators
Source organization:
Development Assistance Committee of the Organisation for Economic Co-operation and Development, Geographical Distribution of Financial Flows to Developing Countries, Development Co-operation Report, and International Development Statistics database. Data are available online at: www.oecd.org/dac/stats/idsonline. World Bank imports of good and services estimates are used for the denominator.
Categories, topics:
Aid Effectiveness
Last updated:
apr 23, 2017
Indicators value changes by year
Meaning:
45.379
Minimum:
25.095
jan 1, 2011
Maximum:
52.535
jan 1, 2014
At the date of observation
Value
Absolute change
Change from the previous value
jan 1, 2010
48.354
+48.354
0.0%
jan 1, 2011
25.095
-23.258
-48.1%
jan 1, 2012
50.154
+25.059
99.85%
jan 1, 2013
51.347
+1.193
2.38%
jan 1, 2014
52.535
+1.188
2.31%
jan 1, 2015
44.789
-7.746
-14.74%
Ranking of countries by current statistics by years