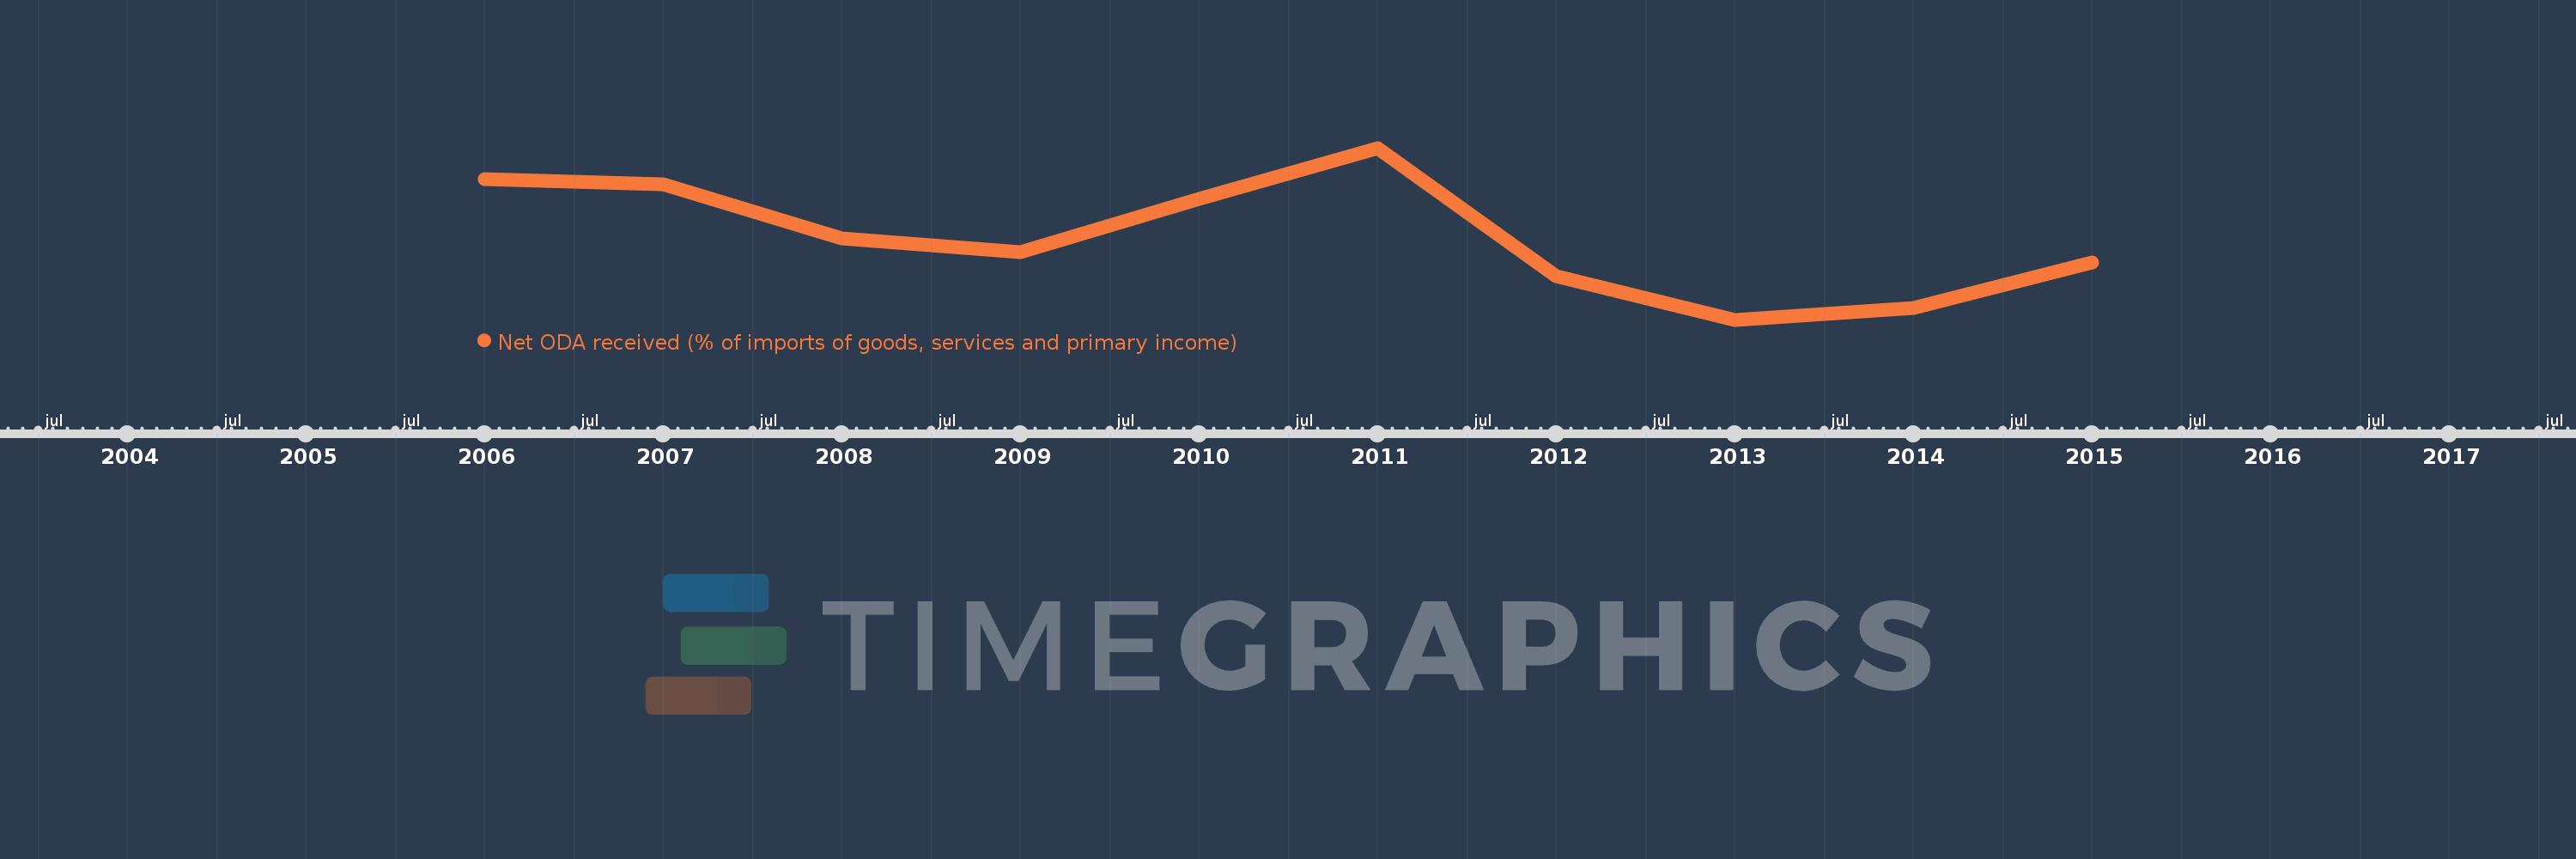
This timeline shows a graph from 2006 to 2015 of Belarus. No data until 2005. Number of actual observations by date: 10.
Source name:
World Development Indicators
Source organization:
Development Assistance Committee of the Organisation for Economic Co-operation and Development, Geographical Distribution of Financial Flows to Developing Countries, Development Co-operation Report, and International Development Statistics database. Data are available online at: www.oecd.org/dac/stats/idsonline. World Bank imports of good and services estimates are used for the denominator.
Categories, topics:
Aid Effectiveness
Last updated:
apr 23, 2017
Indicators value changes by year
Meaning:
0.278
Minimum:
0.2
jan 1, 2013
Maximum:
0.361
jan 1, 2011
At the date of observation
Value
Absolute change
Change from the previous value
jan 1, 2006
0.332
+0.332
0.0%
jan 1, 2007
0.327
-0.005
-1.55%
jan 1, 2008
0.276
-0.051
-15.53%
jan 1, 2009
0.263
-0.013
-4.81%
jan 1, 2010
0.313
+0.05
18.99%
jan 1, 2011
0.361
+0.048
15.46%
jan 1, 2012
0.241
-0.12
-33.16%
jan 1, 2013
0.2
-0.041
-16.97%
jan 1, 2014
0.211
+0.011
5.48%
jan 1, 2015
0.254
+0.043
20.15%
Ranking of countries by current statistics by years