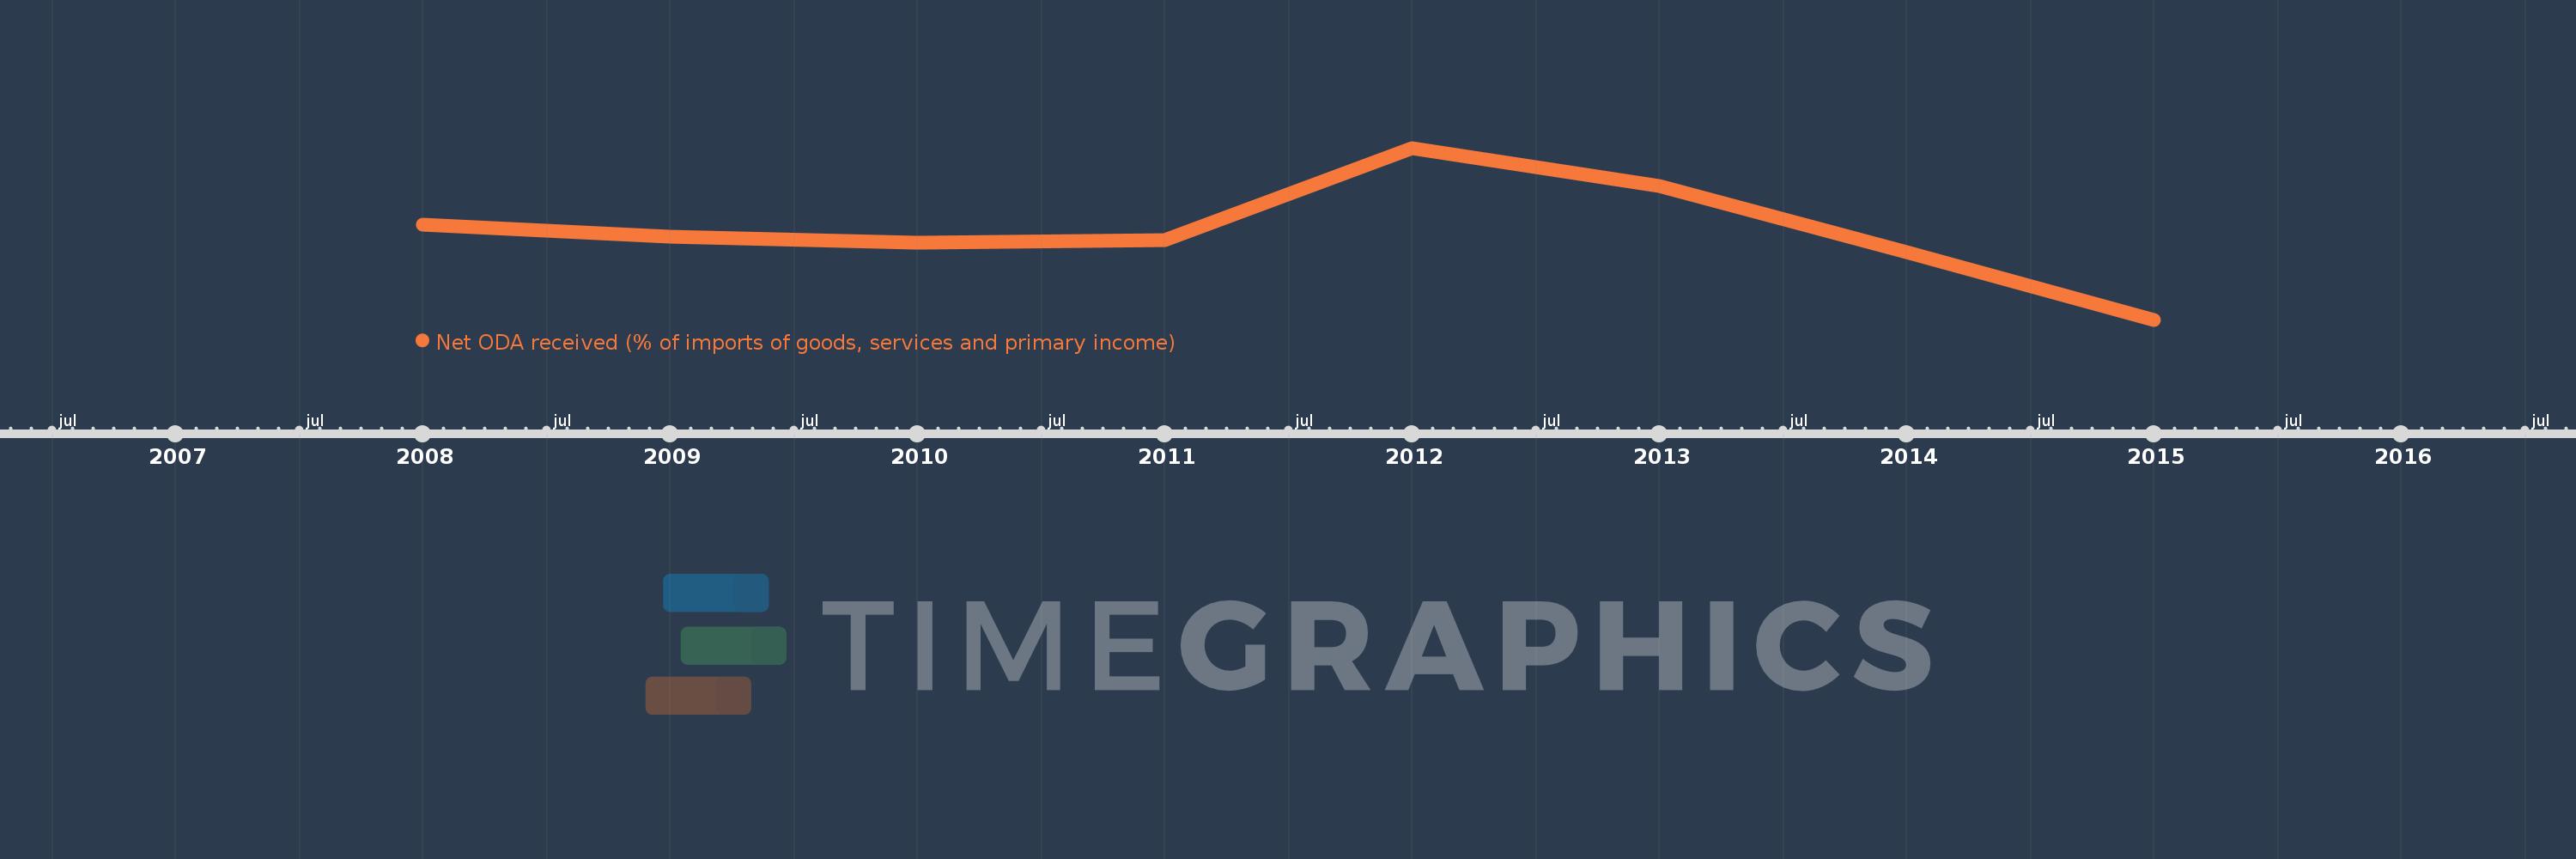
This timeline shows a graph from 2008 to 2015 of Serbia. No data until 2007. Number of actual observations by date: 8.
Source name:
World Development Indicators
Source organization:
Development Assistance Committee of the Organisation for Economic Co-operation and Development, Geographical Distribution of Financial Flows to Developing Countries, Development Co-operation Report, and International Development Statistics database. Data are available online at: www.oecd.org/dac/stats/idsonline. World Bank imports of good and services estimates are used for the denominator.
Categories, topics:
Aid Effectiveness
Last updated:
apr 23, 2017
Indicators value changes by year
Meaning:
3.454
Minimum:
1.392
jan 1, 2015
Maximum:
5.398
jan 1, 2012
At the date of observation
Value
Absolute change
Change from the previous value
jan 1, 2008
3.6
+3.6
0.0%
jan 1, 2009
3.332
-0.268
-7.45%
jan 1, 2010
3.179
-0.154
-4.61%
jan 1, 2011
3.251
+0.072
2.26%
jan 1, 2012
5.398
+2.148
66.07%
jan 1, 2013
4.518
-0.88
-16.3%
jan 1, 2014
2.964
-1.555
-34.41%
jan 1, 2015
1.392
-1.572
-53.03%
Ranking of countries by current statistics by years