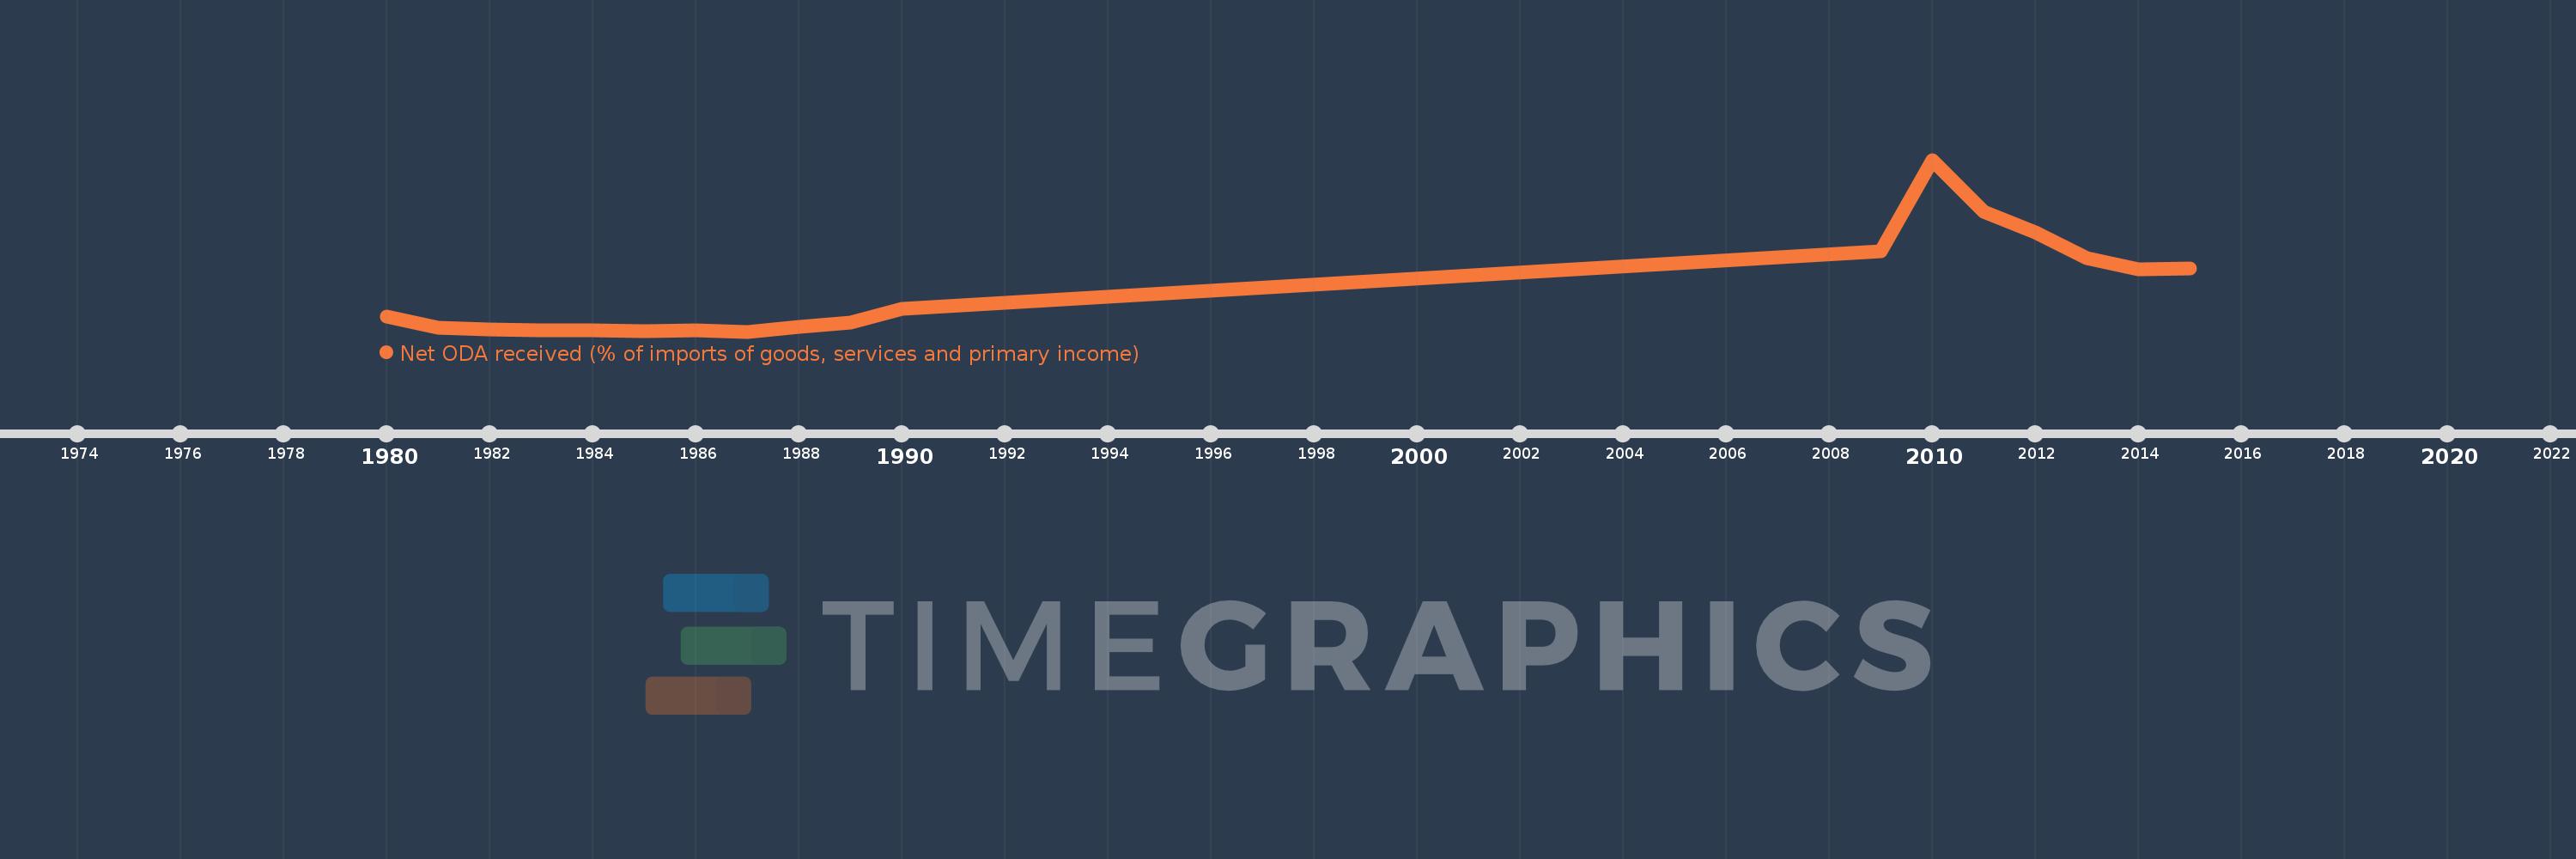
This timeline shows a graph from 1980 to 2015 of Afghanistan. No data until 1979. Number of actual observations by date: 18.
Source name:
World Development Indicators
Source organization:
Development Assistance Committee of the Organisation for Economic Co-operation and Development, Geographical Distribution of Financial Flows to Developing Countries, Development Co-operation Report, and International Development Statistics database. Data are available online at: www.oecd.org/dac/stats/idsonline. World Bank imports of good and services estimates are used for the denominator.
Categories, topics:
Aid Effectiveness
Last updated:
apr 23, 2017
Indicators value changes by year
Meaning:
35.645
Minimum:
0.141
jan 1, 1987
Maximum:
150.01
jan 1, 2010
At the date of observation
Value
Absolute change
Change from the previous value
jan 1, 1980
13.227
+13.227
0.0%
jan 1, 1981
3.571
-9.656
-73.0%
jan 1, 1982
2.213
-1.358
-38.03%
jan 1, 1983
0.943
-1.27
-57.39%
jan 1, 1984
1.249
+0.307
32.52%
jan 1, 1985
0.458
-0.791
-63.35%
jan 1, 1986
1.505
+1.047
228.67%
jan 1, 1987
0.141
-1.364
-90.63%
jan 1, 1988
4.223
+4.082
2.9K%
jan 1, 1989
8.382
+4.158
98.46%
jan 1, 1990
20.185
+11.803
140.82%
jan 1, 2009
70.406
+50.22
248.8%
jan 1, 2010
150.01
+79.605
113.07%
jan 1, 2011
104.418
-45.593
-30.39%
jan 1, 2012
86.601
-17.817
-17.06%
jan 1, 2013
64.316
-22.285
-25.73%
jan 1, 2014
54.528
-9.788
-15.22%
jan 1, 2015
55.231
+0.704
1.29%
Ranking of countries by current statistics by years