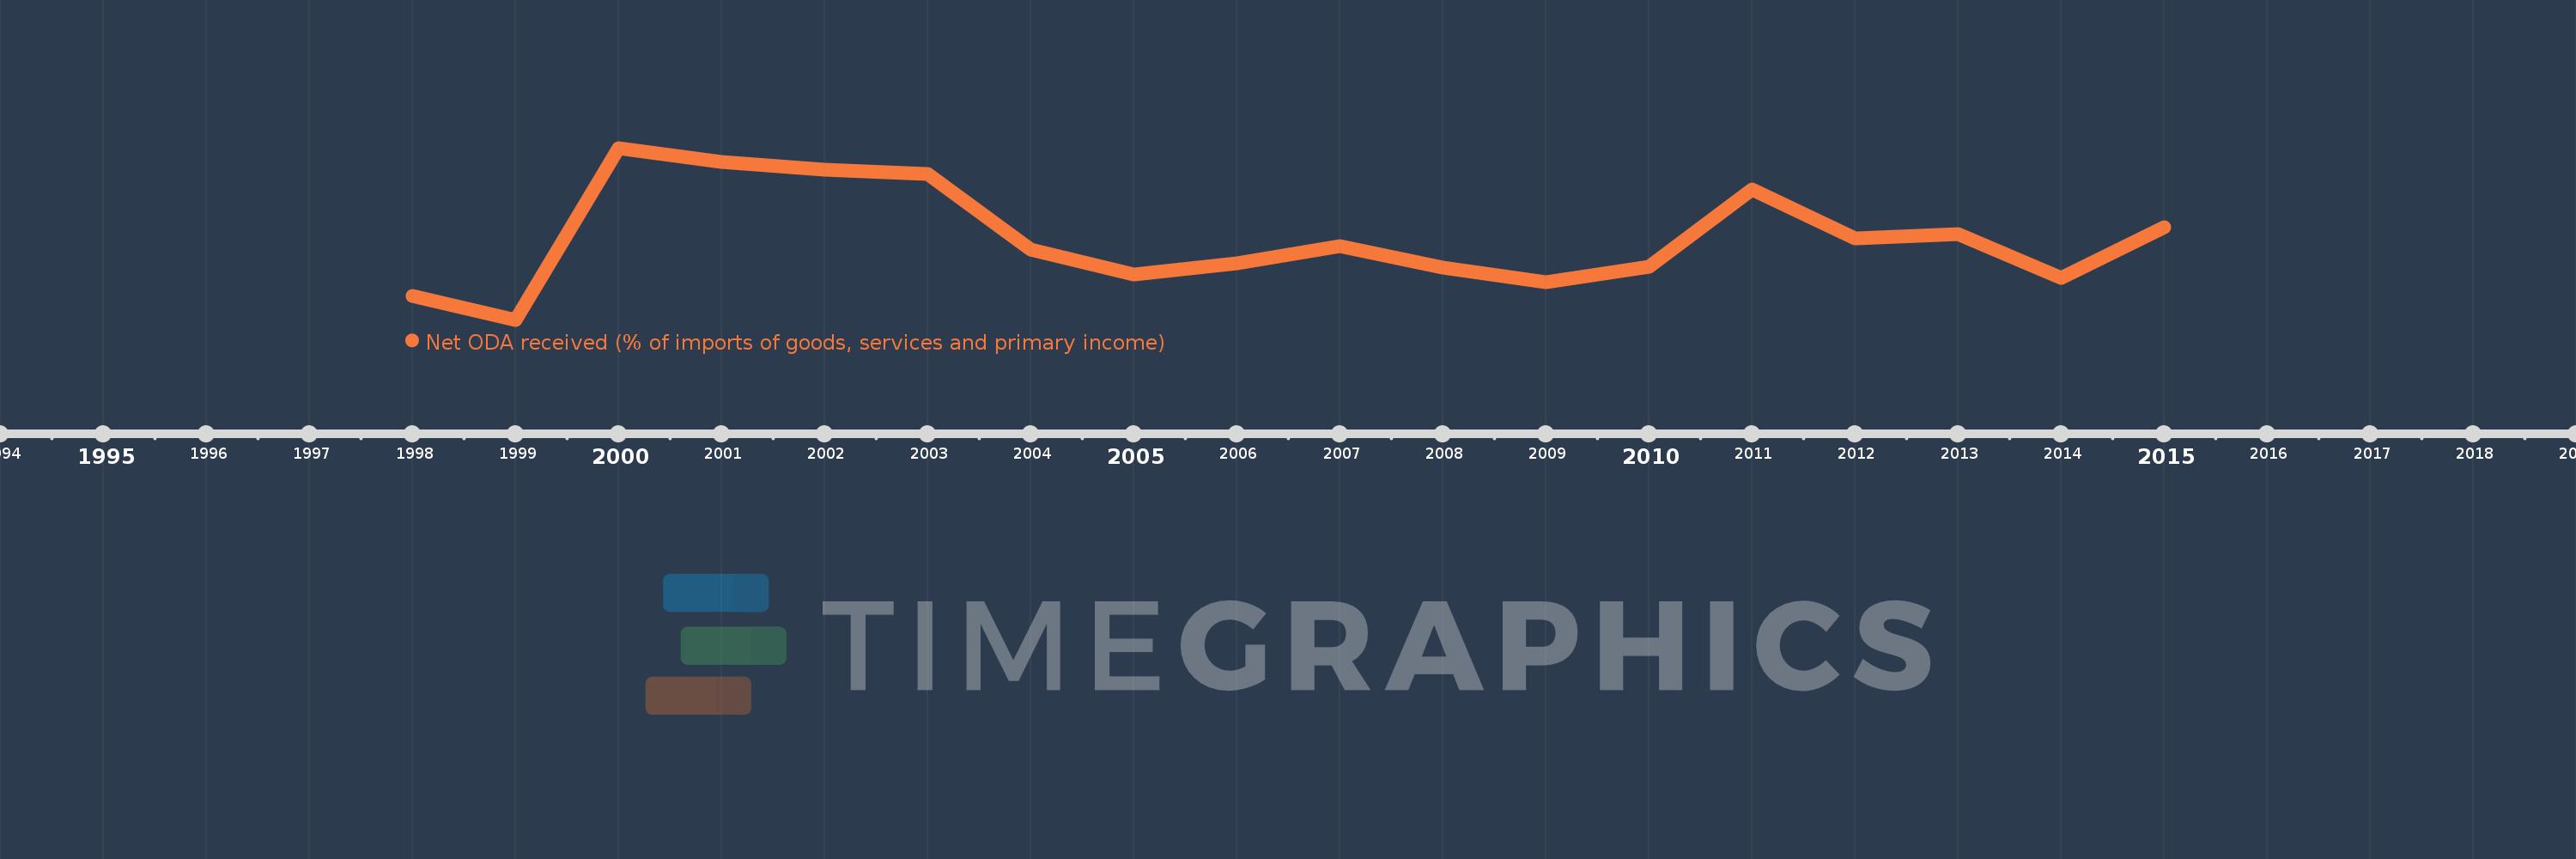
This timeline shows a graph from 1998 to 2015 of Moldova. No data until 1997. Number of actual observations by date: 18.
Source name:
World Development Indicators
Source organization:
Development Assistance Committee of the Organisation for Economic Co-operation and Development, Geographical Distribution of Financial Flows to Developing Countries, Development Co-operation Report, and International Development Statistics database. Data are available online at: www.oecd.org/dac/stats/idsonline. World Bank imports of good and services estimates are used for the denominator.
Categories, topics:
Aid Effectiveness
Last updated:
apr 23, 2017
Indicators value changes by year
Meaning:
7.782
Minimum:
3.105
jan 1, 1999
Maximum:
12.962
jan 1, 2000
At the date of observation
Value
Absolute change
Change from the previous value
jan 1, 1998
4.46
+4.46
0.0%
jan 1, 1999
3.105
-1.354
-30.37%
jan 1, 2000
12.962
+9.856
317.4%
jan 1, 2001
12.148
-0.814
-6.28%
jan 1, 2002
11.699
-0.449
-3.7%
jan 1, 2003
11.445
-0.254
-2.17%
jan 1, 2004
7.135
-4.31
-37.66%
jan 1, 2005
5.691
-1.444
-20.23%
jan 1, 2006
6.327
+0.636
11.17%
jan 1, 2007
7.343
+1.016
16.05%
jan 1, 2008
6.109
-1.234
-16.8%
jan 1, 2009
5.258
-0.851
-13.92%
jan 1, 2010
6.127
+0.869
16.52%
jan 1, 2011
10.559
+4.432
72.34%
jan 1, 2012
7.788
-2.771
-26.25%
jan 1, 2013
8.027
+0.239
3.07%
jan 1, 2014
5.495
-2.532
-31.54%
jan 1, 2015
8.393
+2.898
52.74%
Ranking of countries by current statistics by years