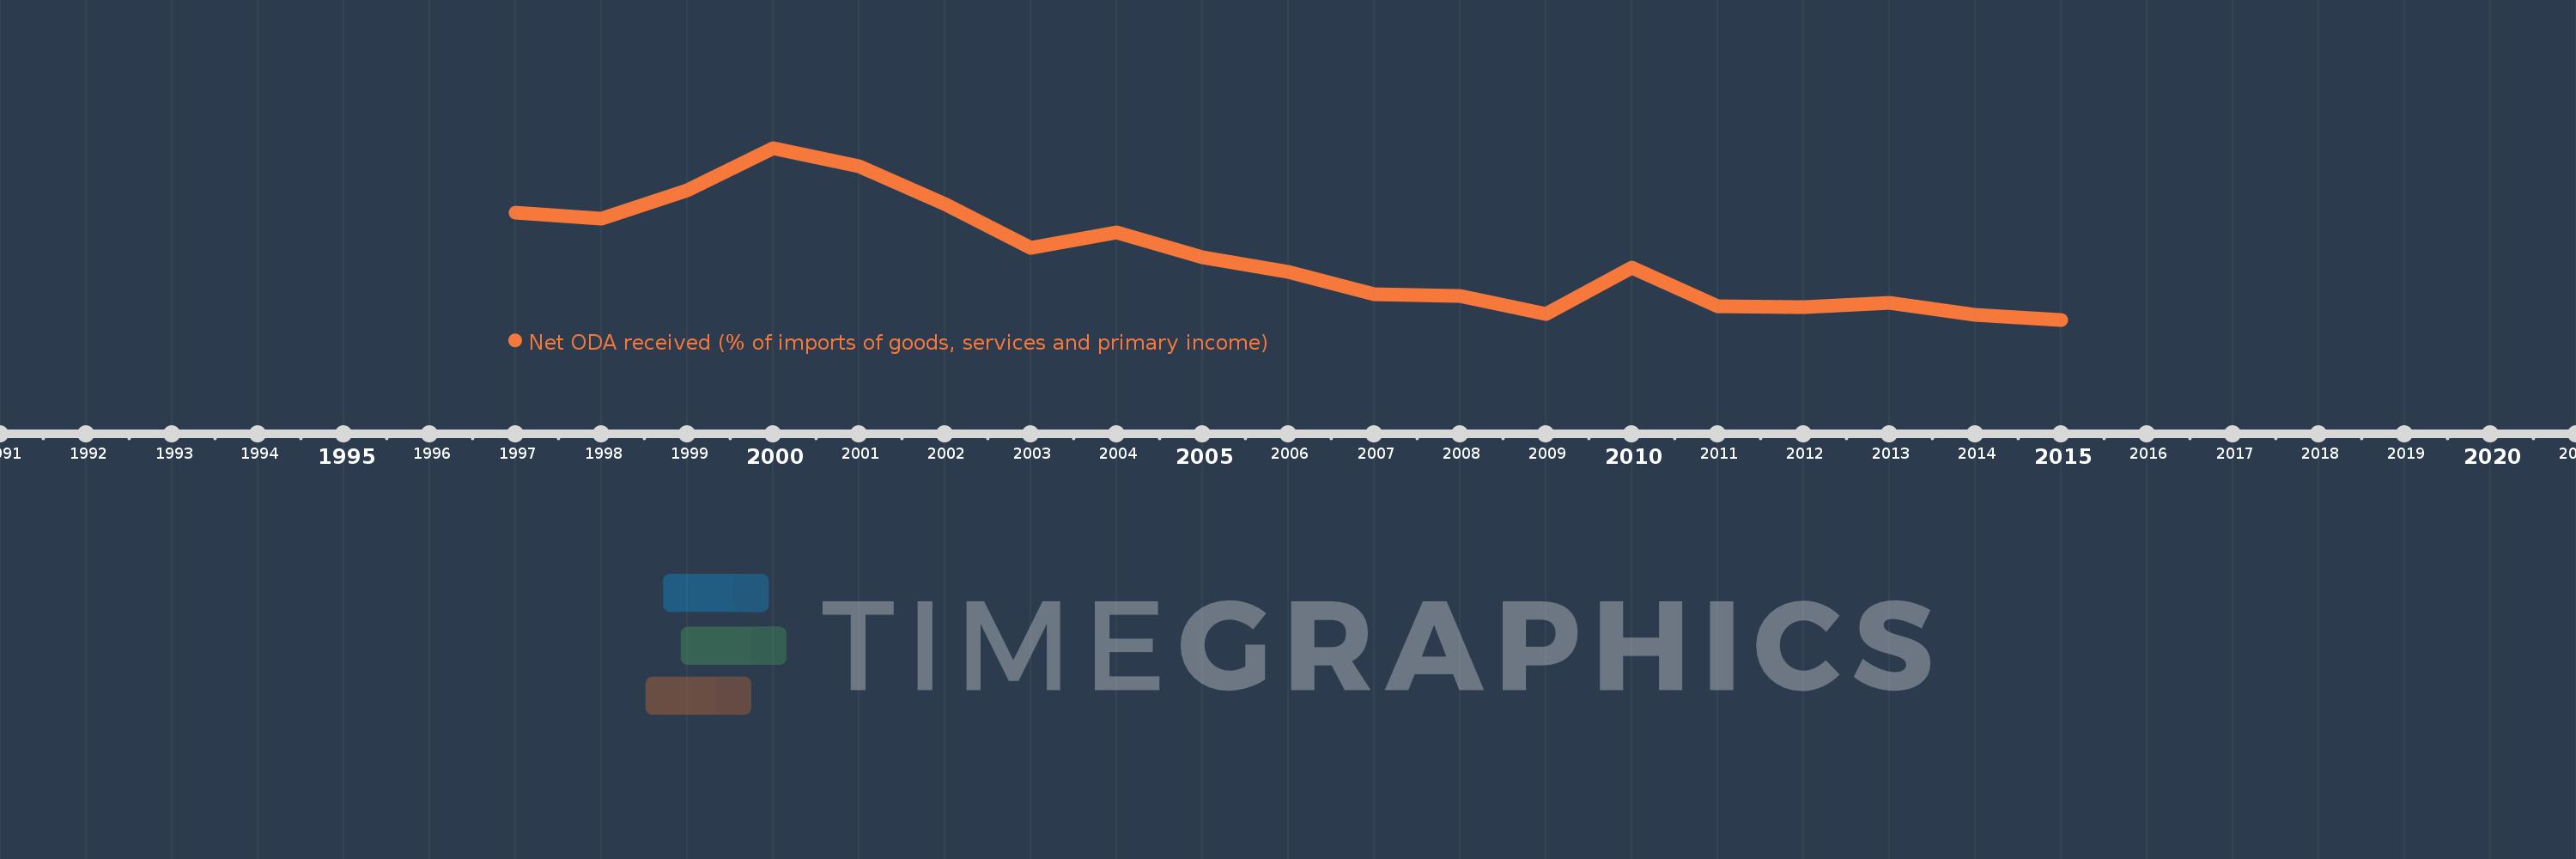
This timeline shows a graph from 1997 to 2015 of Vietnam. No data until 1996. Number of actual observations by date: 19.
Source name:
World Development Indicators
Source organization:
Development Assistance Committee of the Organisation for Economic Co-operation and Development, Geographical Distribution of Financial Flows to Developing Countries, Development Co-operation Report, and International Development Statistics database. Data are available online at: www.oecd.org/dac/stats/idsonline. World Bank imports of good and services estimates are used for the denominator.
Categories, topics:
Aid Effectiveness
Last updated:
apr 23, 2017
Indicators value changes by year
Meaning:
5.359
Minimum:
2.608
jan 1, 2015
Maximum:
10.075
jan 1, 2000
At the date of observation
Value
Absolute change
Change from the previous value
jan 1, 1997
7.28
+7.28
0.0%
jan 1, 1998
6.998
-0.281
-3.86%
jan 1, 1999
8.233
+1.235
17.64%
jan 1, 2000
10.075
+1.842
22.38%
jan 1, 2001
9.286
-0.79
-7.84%
jan 1, 2002
7.648
-1.638
-17.64%
jan 1, 2003
5.729
-1.919
-25.09%
jan 1, 2004
6.393
+0.664
11.59%
jan 1, 2005
5.338
-1.055
-16.51%
jan 1, 2006
4.675
-0.662
-12.41%
jan 1, 2007
3.703
-0.972
-20.79%
jan 1, 2008
3.632
-0.072
-1.94%
jan 1, 2009
2.861
-0.77
-21.21%
jan 1, 2010
4.867
+2.006
70.09%
jan 1, 2011
3.184
-1.683
-34.59%
jan 1, 2012
3.157
-0.027
-0.86%
jan 1, 2013
3.334
+0.177
5.62%
jan 1, 2014
2.821
-0.513
-15.39%
jan 1, 2015
2.608
-0.213
-7.56%
Ranking of countries by current statistics by years