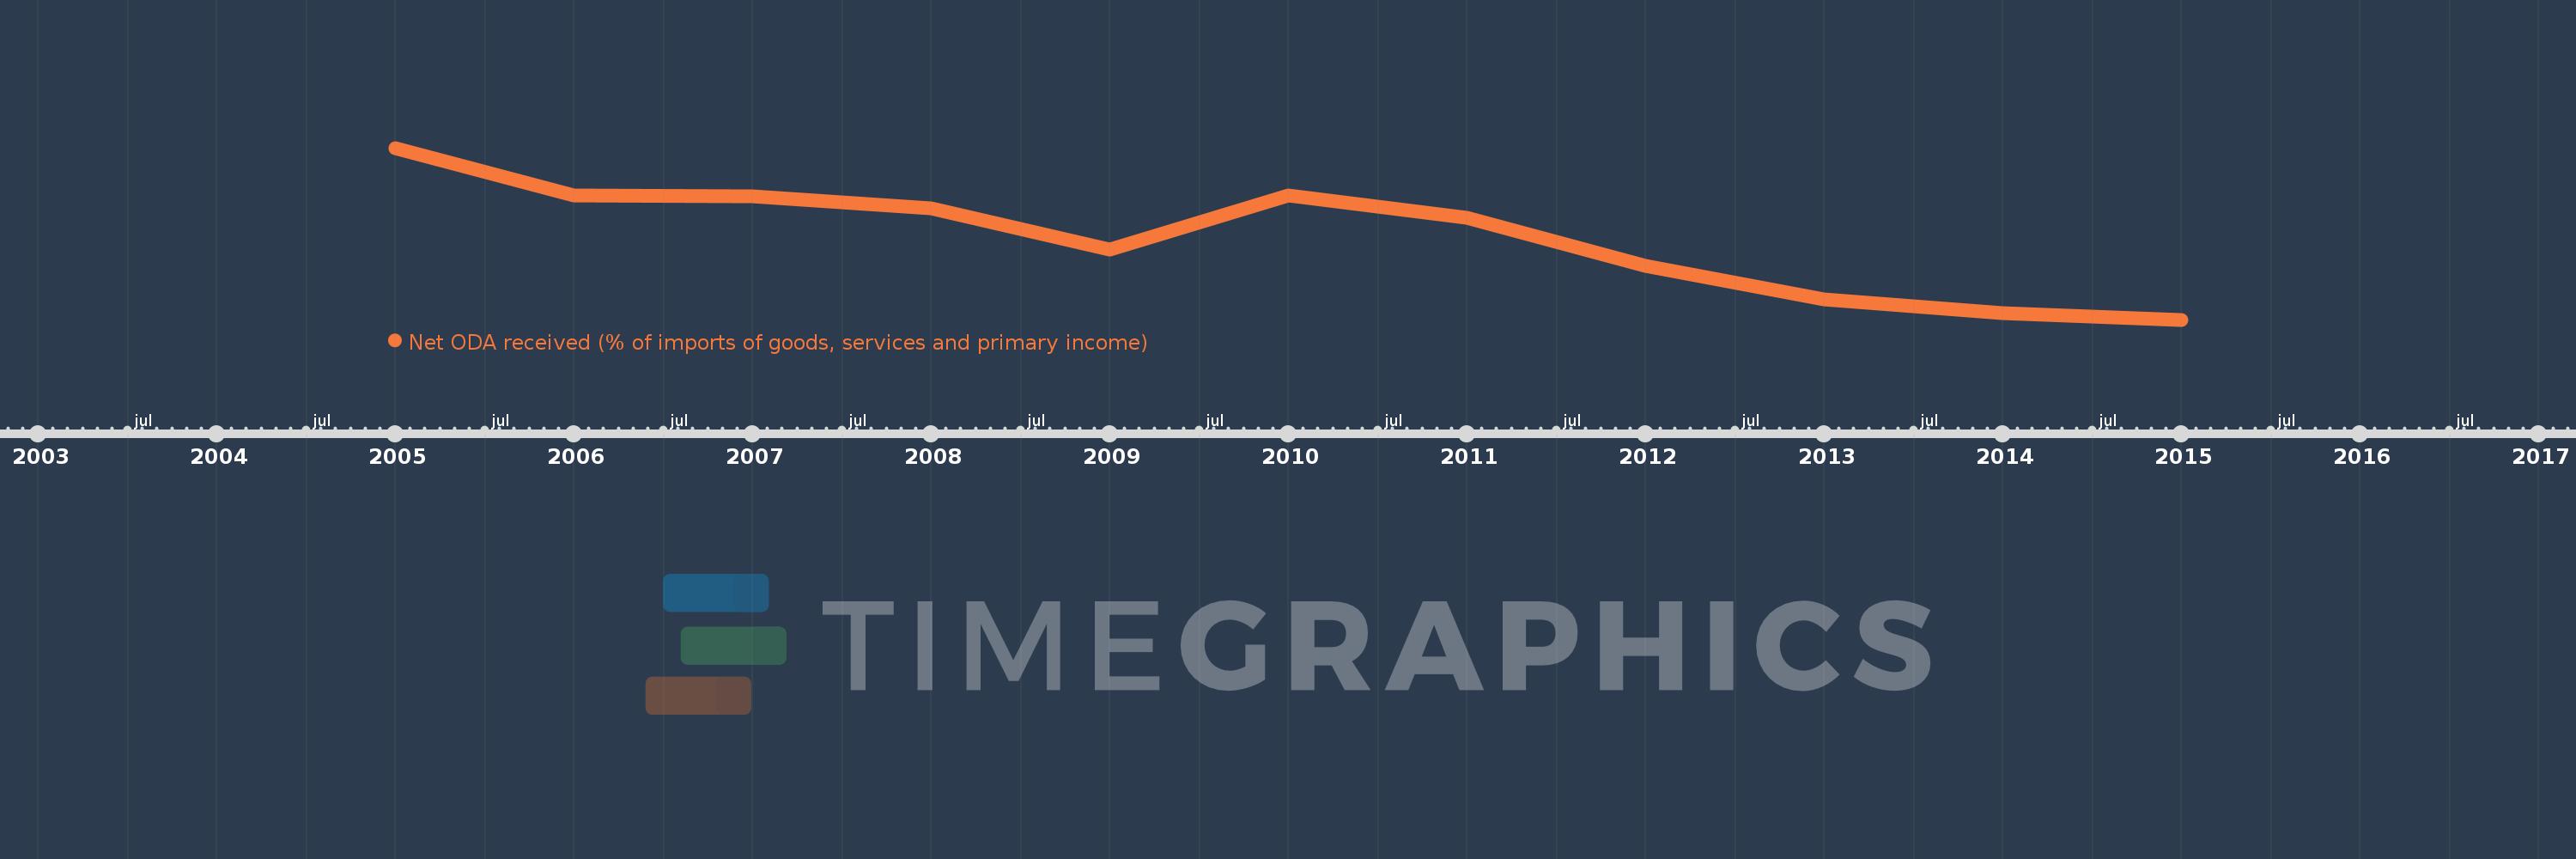
This timeline shows a graph from 2005 to 2015 of Low income. No data until 2004. Number of actual observations by date: 11.
Source name:
World Development Indicators
Source organization:
Development Assistance Committee of the Organisation for Economic Co-operation and Development, Geographical Distribution of Financial Flows to Developing Countries, Development Co-operation Report, and International Development Statistics database. Data are available online at: www.oecd.org/dac/stats/idsonline. World Bank imports of good and services estimates are used for the denominator.
Categories, topics:
Aid Effectiveness
Last updated:
apr 23, 2017
Indicators value changes by year
Meaning:
28.994
Minimum:
19.97
jan 1, 2015
Maximum:
38.764
jan 1, 2005
At the date of observation
Value
Absolute change
Change from the previous value
jan 1, 2005
38.764
+38.764
0.0%
jan 1, 2006
33.543
-5.22
-13.47%
jan 1, 2007
33.466
-0.078
-0.23%
jan 1, 2008
32.158
-1.307
-3.91%
jan 1, 2009
27.654
-4.505
-14.01%
jan 1, 2010
33.539
+5.885
21.28%
jan 1, 2011
31.163
-2.377
-7.09%
jan 1, 2012
25.815
-5.347
-17.16%
jan 1, 2013
22.189
-3.627
-14.05%
jan 1, 2014
20.675
-1.514
-6.82%
jan 1, 2015
19.97
-0.705
-3.41%
Ranking of countries by current statistics by years