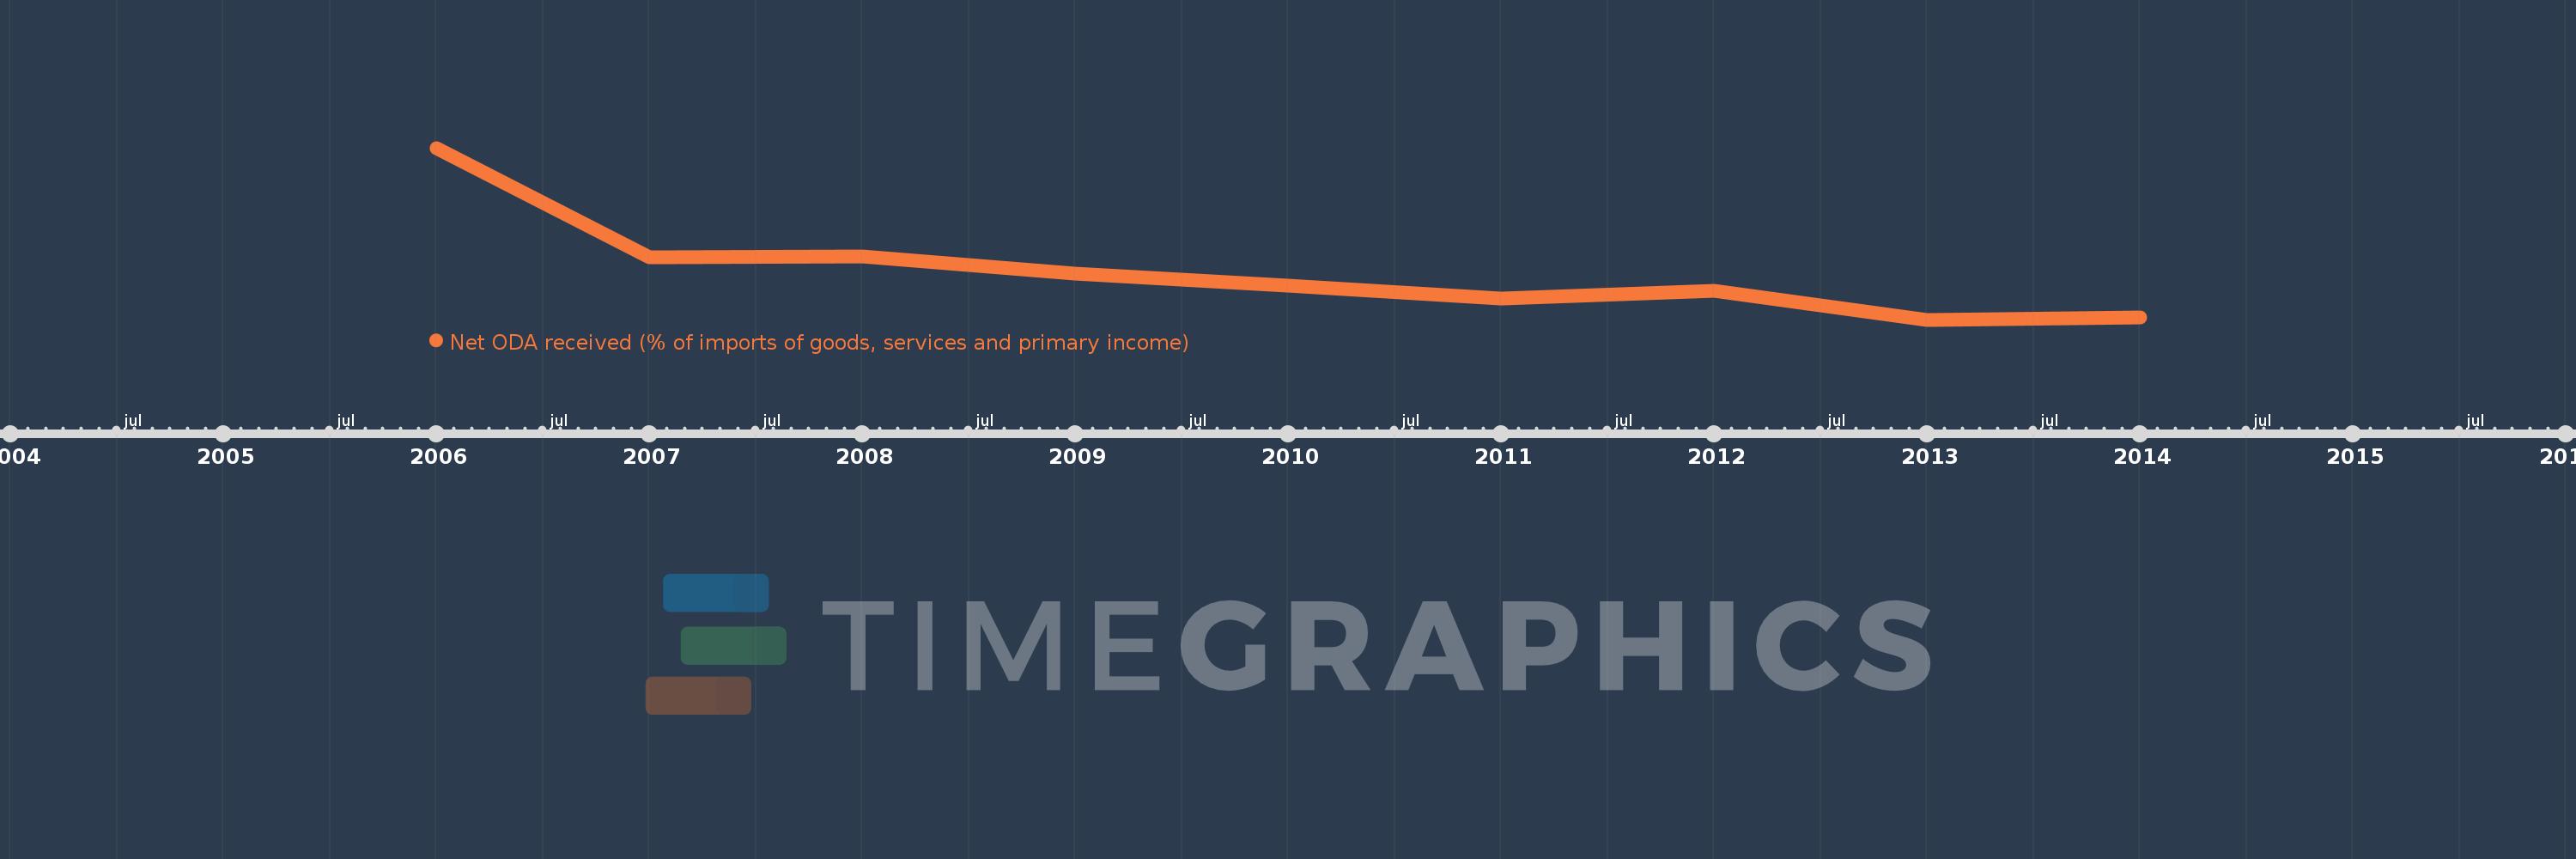
This timeline shows a graph from 2006 to 2014 of Fragile and conflict affected situations. No data until 2005. Number of actual observations by date: 9.
Source name:
World Development Indicators
Source organization:
Development Assistance Committee of the Organisation for Economic Co-operation and Development, Geographical Distribution of Financial Flows to Developing Countries, Development Co-operation Report, and International Development Statistics database. Data are available online at: www.oecd.org/dac/stats/idsonline. World Bank imports of good and services estimates are used for the denominator.
Categories, topics:
Aid Effectiveness
Last updated:
apr 23, 2017
Indicators value changes by year
Meaning:
14.511
Minimum:
10.397
jan 1, 2013
Maximum:
25.192
jan 1, 2006
At the date of observation
Value
Absolute change
Change from the previous value
jan 1, 2006
25.192
+25.192
0.0%
jan 1, 2007
15.766
-9.425
-37.41%
jan 1, 2008
15.838
+0.072
0.46%
jan 1, 2009
14.406
-1.432
-9.04%
jan 1, 2010
13.36
-1.046
-7.26%
jan 1, 2011
12.202
-1.158
-8.67%
jan 1, 2012
12.856
+0.654
5.36%
jan 1, 2013
10.397
-2.46
-19.13%
jan 1, 2014
10.579
+0.182
1.75%
Ranking of countries by current statistics by years