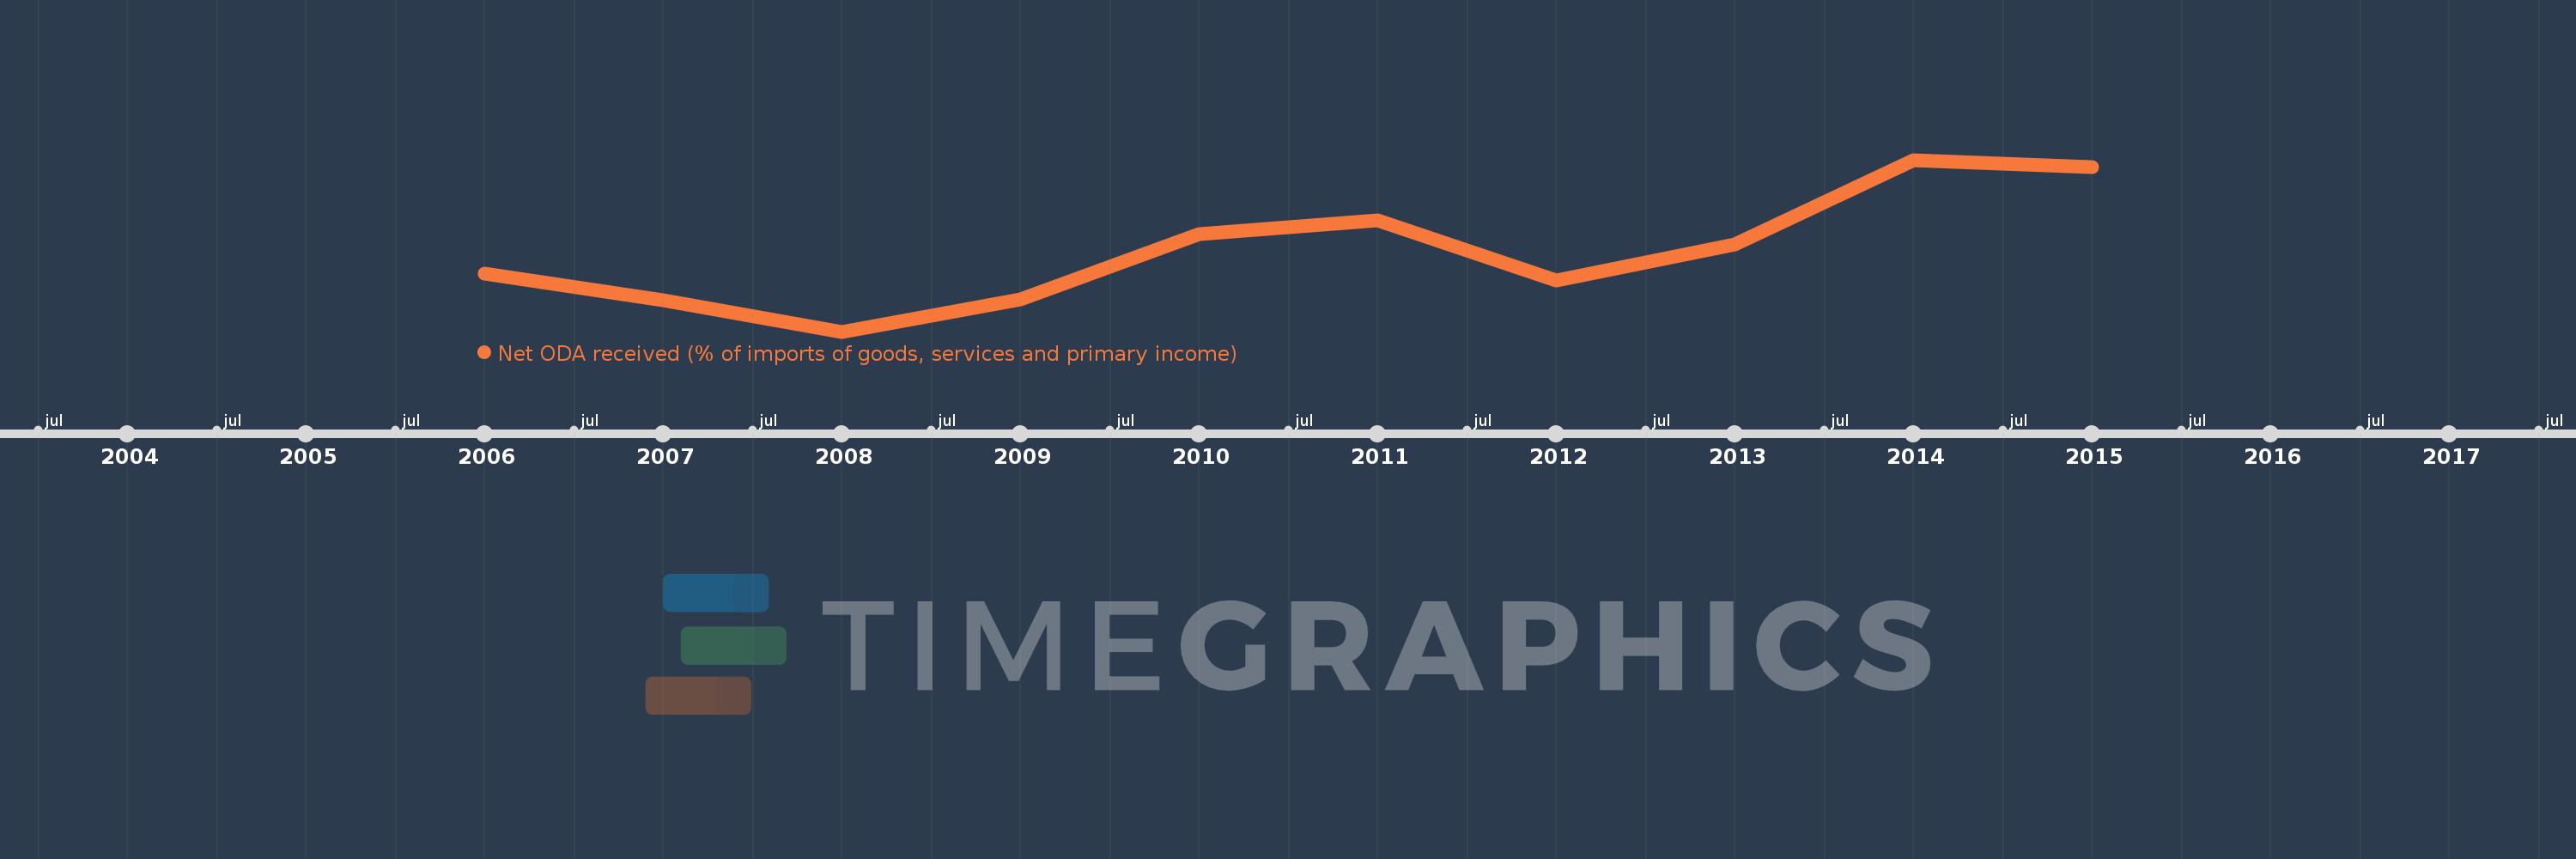
This timeline shows a graph from 2006 to 2015 of Yemen, Rep.. No data until 2005. Number of actual observations by date: 10.
Source name:
World Development Indicators
Source organization:
Development Assistance Committee of the Organisation for Economic Co-operation and Development, Geographical Distribution of Financial Flows to Developing Countries, Development Co-operation Report, and International Development Statistics database. Data are available online at: www.oecd.org/dac/stats/idsonline. World Bank imports of good and services estimates are used for the denominator.
Categories, topics:
Aid Effectiveness
Last updated:
apr 23, 2017
Indicators value changes by year
Meaning:
4.466
Minimum:
2.187
jan 1, 2008
Maximum:
7.048
jan 1, 2014
At the date of observation
Value
Absolute change
Change from the previous value
jan 1, 2006
3.829
+3.829
0.0%
jan 1, 2007
3.08
-0.749
-19.56%
jan 1, 2008
2.187
-0.893
-29.0%
jan 1, 2009
3.087
+0.9
41.16%
jan 1, 2010
4.947
+1.861
60.28%
jan 1, 2011
5.331
+0.384
7.75%
jan 1, 2012
3.636
-1.695
-31.8%
jan 1, 2013
4.664
+1.028
28.28%
jan 1, 2014
7.048
+2.385
51.13%
jan 1, 2015
6.846
-0.202
-2.87%
Ranking of countries by current statistics by years