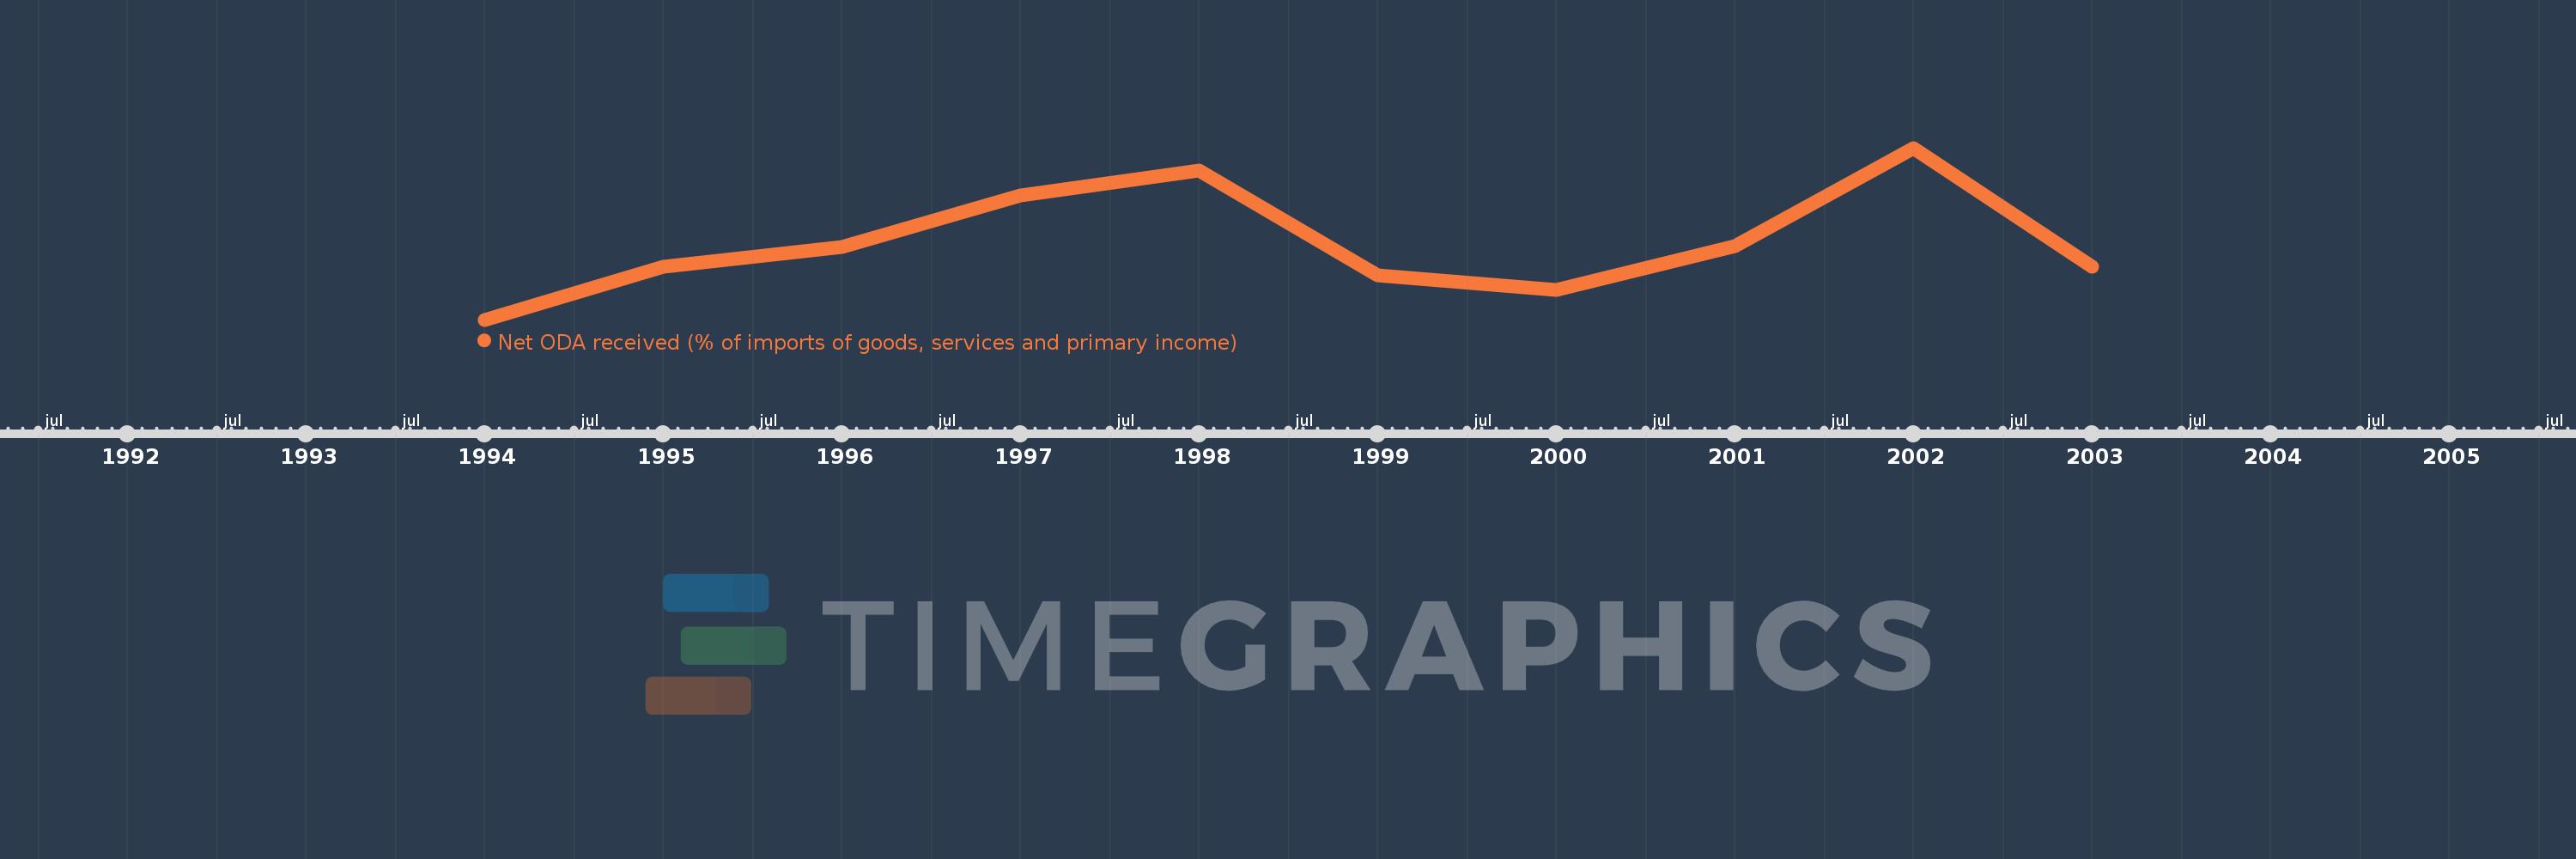
This timeline shows a graph from 1994 to 2003 of Slovenia. No data until 1993. Number of actual observations by date: 10.
Source name:
World Development Indicators
Source organization:
Development Assistance Committee of the Organisation for Economic Co-operation and Development, Geographical Distribution of Financial Flows to Developing Countries, Development Co-operation Report, and International Development Statistics database. Data are available online at: www.oecd.org/dac/stats/idsonline. World Bank imports of good and services estimates are used for the denominator.
Categories, topics:
Aid Effectiveness
Last updated:
apr 23, 2017
Indicators value changes by year
Meaning:
0.539
Minimum:
0.109
jan 1, 1994
Maximum:
1.064
jan 1, 2002
At the date of observation
Value
Absolute change
Change from the previous value
jan 1, 1994
0.109
+0.109
0.0%
jan 1, 1995
0.406
+0.297
273.12%
jan 1, 1996
0.513
+0.107
26.37%
jan 1, 1997
0.8
+0.286
55.81%
jan 1, 1998
0.94
+0.14
17.49%
jan 1, 1999
0.356
-0.583
-62.08%
jan 1, 2000
0.277
-0.08
-22.32%
jan 1, 2001
0.518
+0.241
87.01%
jan 1, 2002
1.064
+0.546
105.57%
jan 1, 2003
0.405
-0.659
-61.92%
Ranking of countries by current statistics by years