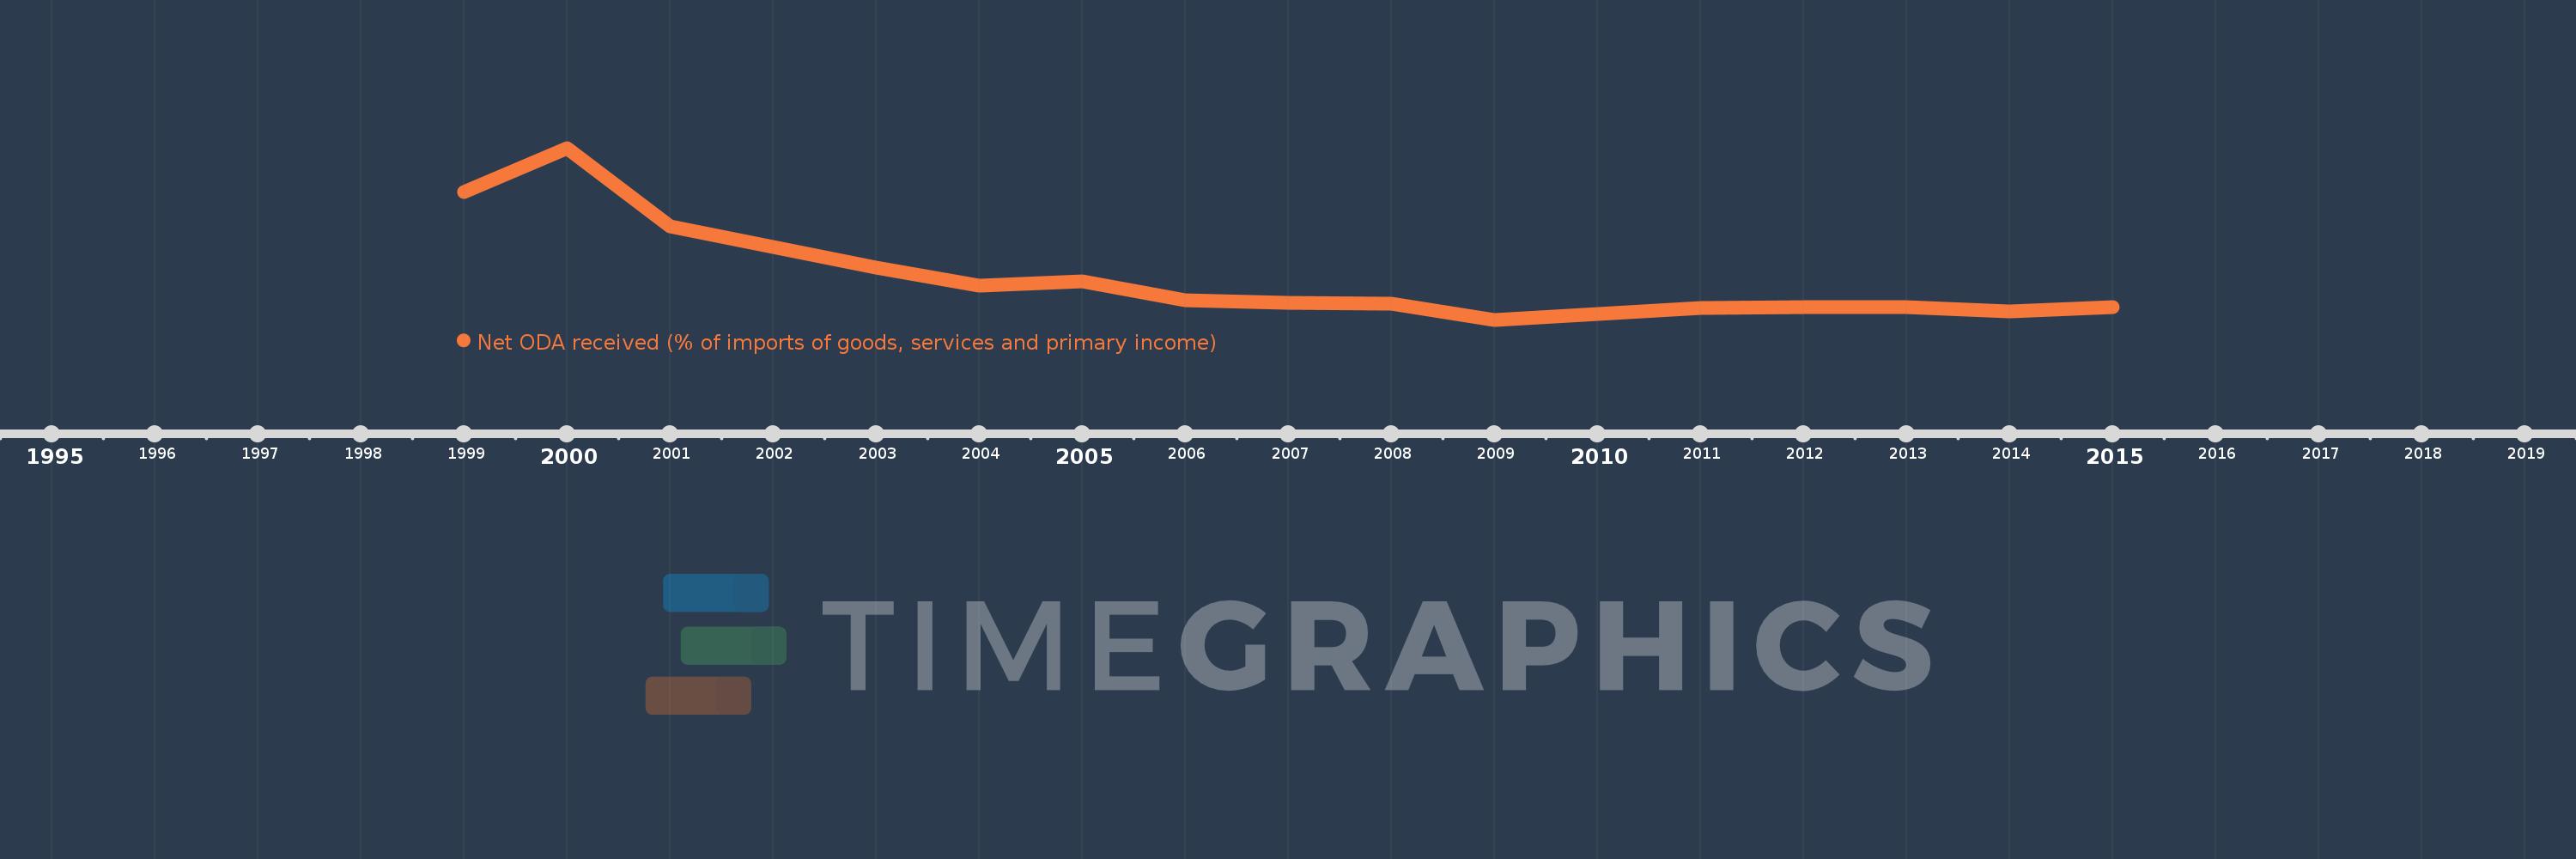
This timeline shows a graph from 1999 to 2015 of Bosnia and Herzegovina. No data until 1998. Number of actual observations by date: 17.
Source name:
World Development Indicators
Source organization:
Development Assistance Committee of the Organisation for Economic Co-operation and Development, Geographical Distribution of Financial Flows to Developing Countries, Development Co-operation Report, and International Development Statistics database. Data are available online at: www.oecd.org/dac/stats/idsonline. World Bank imports of good and services estimates are used for the denominator.
Categories, topics:
Aid Effectiveness
Last updated:
apr 23, 2017
Indicators value changes by year
Meaning:
9.903
Minimum:
3.914
jan 1, 2009
Maximum:
28.719
jan 1, 2000
At the date of observation
Value
Absolute change
Change from the previous value
jan 1, 1999
22.298
+22.298
0.0%
jan 1, 2000
28.719
+6.421
28.79%
jan 1, 2001
17.43
-11.289
-39.31%
jan 1, 2002
14.371
-3.059
-17.55%
jan 1, 2003
11.455
-2.916
-20.29%
jan 1, 2004
8.825
-2.63
-22.96%
jan 1, 2005
9.454
+0.629
7.13%
jan 1, 2006
6.77
-2.684
-28.39%
jan 1, 2007
6.304
-0.466
-6.88%
jan 1, 2008
6.262
-0.042
-0.66%
jan 1, 2009
3.914
-2.349
-37.5%
jan 1, 2010
4.685
+0.771
19.71%
jan 1, 2011
5.577
+0.892
19.04%
jan 1, 2012
5.731
+0.154
2.76%
jan 1, 2013
5.684
-0.047
-0.82%
jan 1, 2014
5.124
-0.56
-9.86%
jan 1, 2015
5.741
+0.617
12.04%
Ranking of countries by current statistics by years