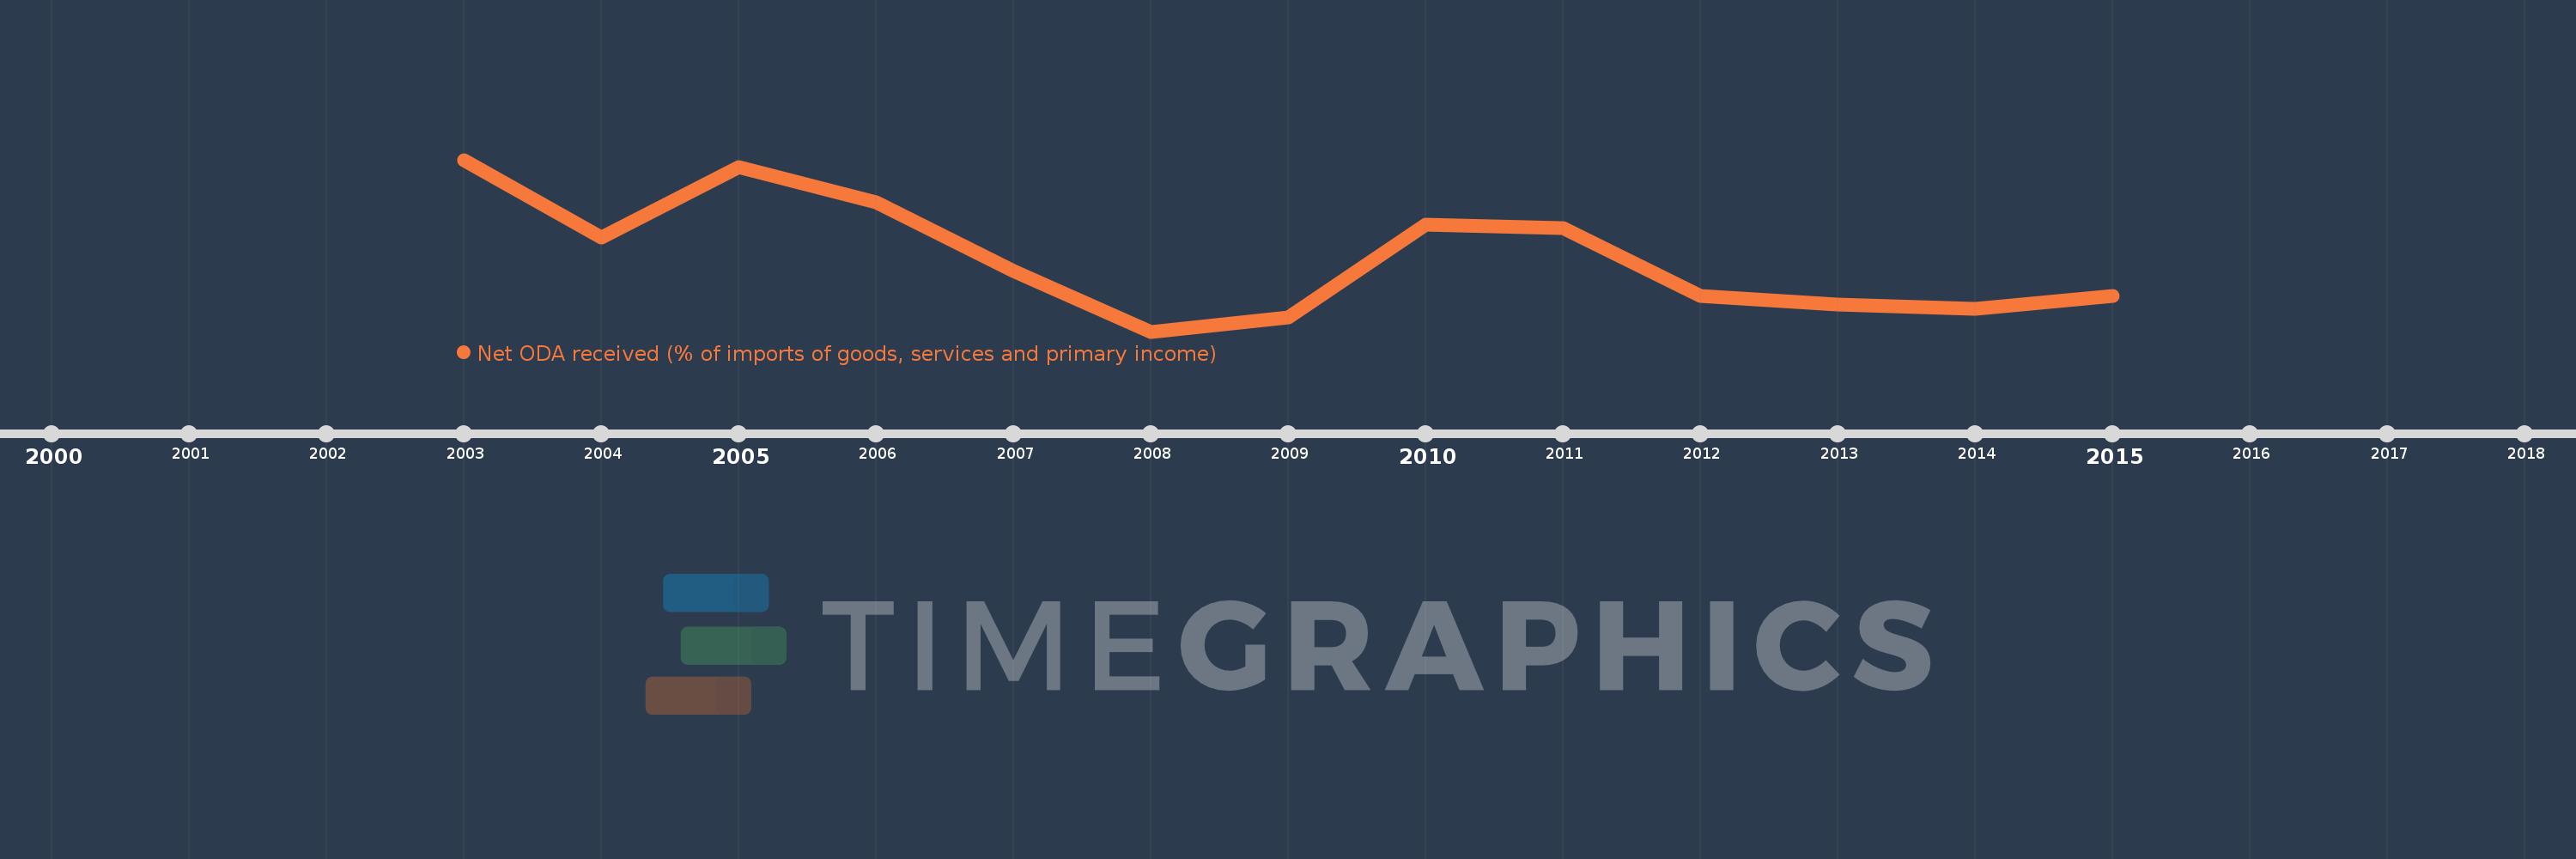
This timeline shows a graph from 2003 to 2015 of Tajikistan. No data until 2002. Number of actual observations by date: 13.
Source name:
World Development Indicators
Source organization:
Development Assistance Committee of the Organisation for Economic Co-operation and Development, Geographical Distribution of Financial Flows to Developing Countries, Development Co-operation Report, and International Development Statistics database. Data are available online at: www.oecd.org/dac/stats/idsonline. World Bank imports of good and services estimates are used for the denominator.
Categories, topics:
Aid Effectiveness
Last updated:
apr 23, 2017
Indicators value changes by year
Meaning:
10.841
Minimum:
5.876
jan 1, 2008
Maximum:
17.353
jan 1, 2003
At the date of observation
Value
Absolute change
Change from the previous value
jan 1, 2003
17.353
+17.353
0.0%
jan 1, 2004
12.155
-5.198
-29.95%
jan 1, 2005
16.848
+4.692
38.6%
jan 1, 2006
14.514
-2.334
-13.85%
jan 1, 2007
9.946
-4.568
-31.47%
jan 1, 2008
5.876
-4.071
-40.93%
jan 1, 2009
6.83
+0.954
16.24%
jan 1, 2010
12.995
+6.165
90.27%
jan 1, 2011
12.809
-0.186
-1.43%
jan 1, 2012
8.247
-4.562
-35.61%
jan 1, 2013
7.686
-0.561
-6.81%
jan 1, 2014
7.409
-0.277
-3.61%
jan 1, 2015
8.268
+0.859
11.6%
Ranking of countries by current statistics by years