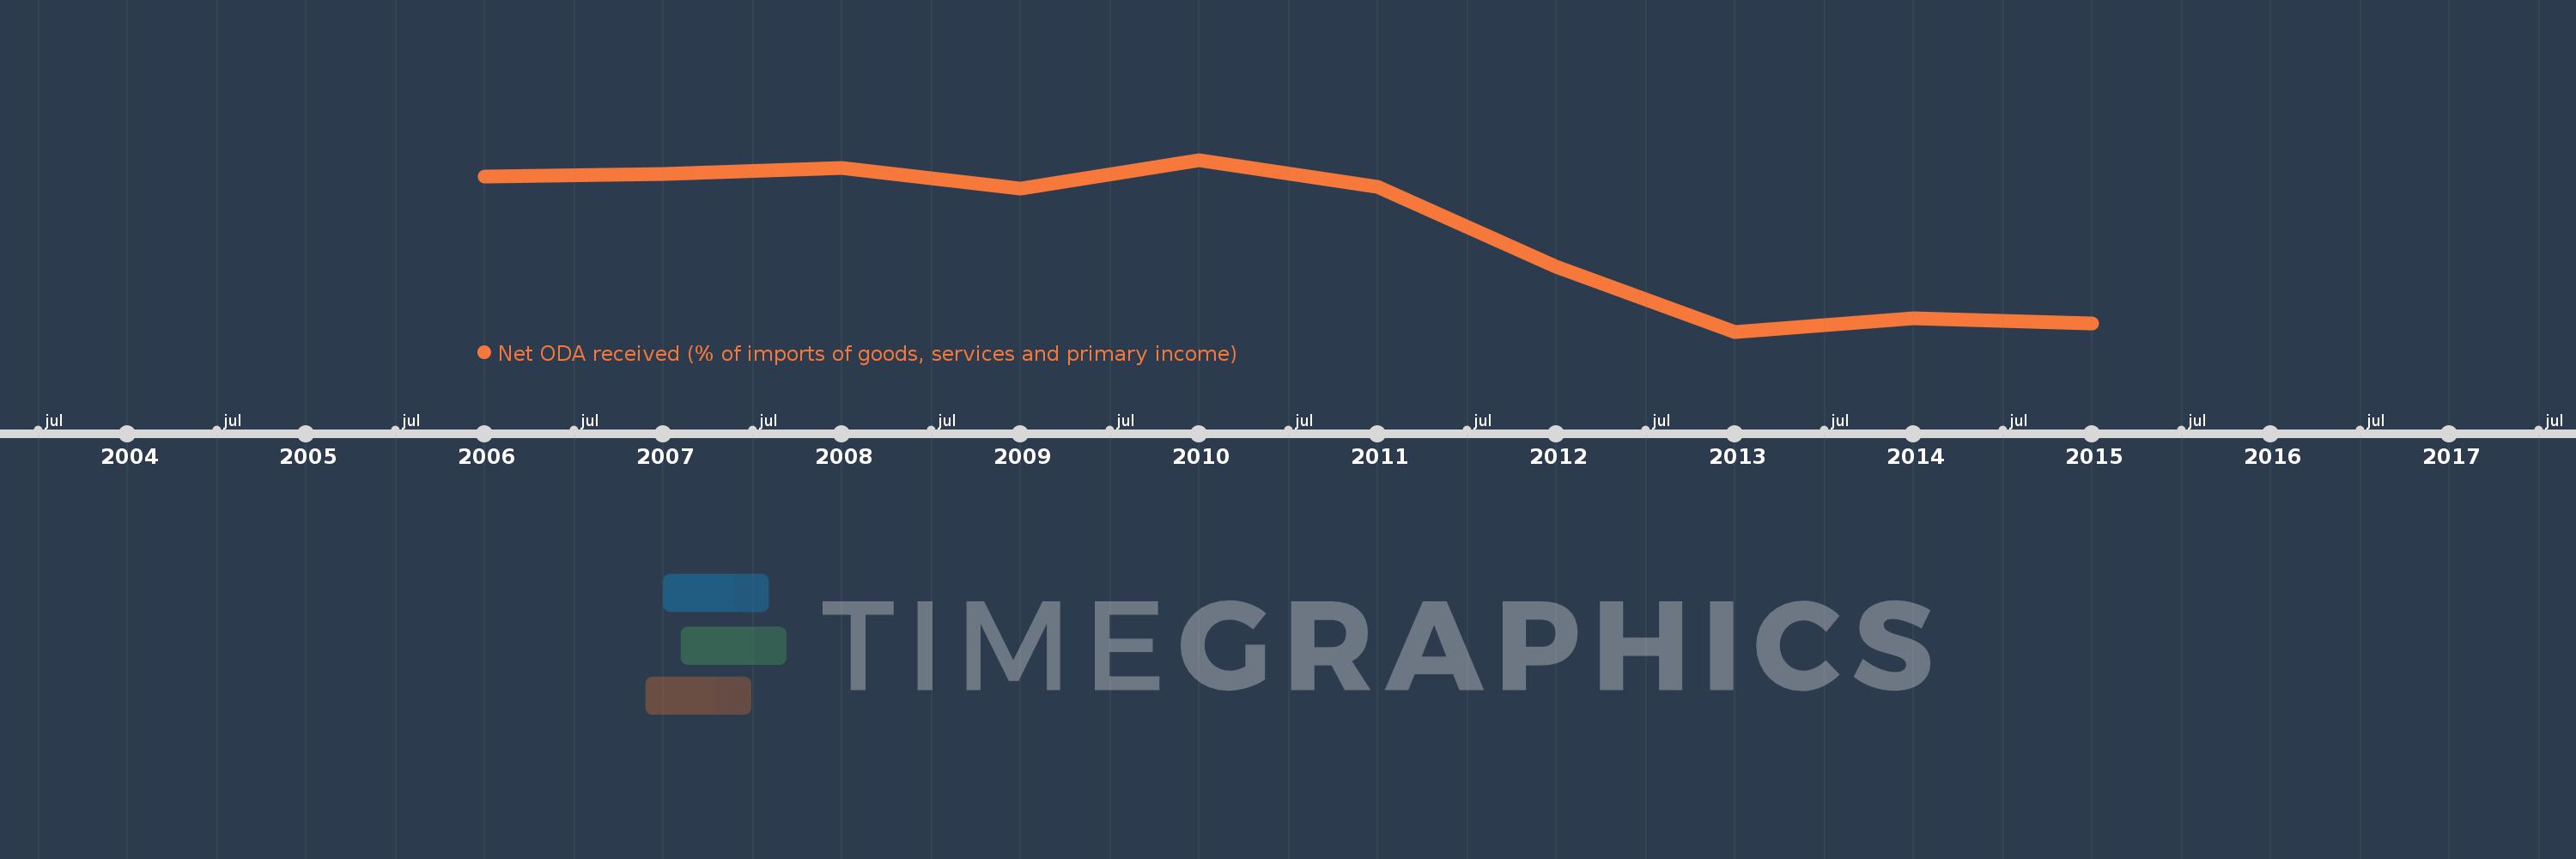
This timeline shows a graph from 2006 to 2015 of Mozambique. No data until 2005. Number of actual observations by date: 10.
Source name:
World Development Indicators
Source organization:
Development Assistance Committee of the Organisation for Economic Co-operation and Development, Geographical Distribution of Financial Flows to Developing Countries, Development Co-operation Report, and International Development Statistics database. Data are available online at: www.oecd.org/dac/stats/idsonline. World Bank imports of good and services estimates are used for the denominator.
Categories, topics:
Aid Effectiveness
Last updated:
apr 23, 2017
Indicators value changes by year
Meaning:
31.119
Minimum:
16.448
jan 1, 2013
Maximum:
41.083
jan 1, 2010
At the date of observation
Value
Absolute change
Change from the previous value
jan 1, 2006
38.725
+38.725
0.0%
jan 1, 2007
39.098
+0.373
0.96%
jan 1, 2008
39.897
+0.799
2.04%
jan 1, 2009
36.921
-2.976
-7.46%
jan 1, 2010
41.083
+4.161
11.27%
jan 1, 2011
37.185
-3.898
-9.49%
jan 1, 2012
25.807
-11.378
-30.6%
jan 1, 2013
16.448
-9.359
-36.26%
jan 1, 2014
18.405
+1.957
11.9%
jan 1, 2015
17.619
-0.786
-4.27%
Ranking of countries by current statistics by years