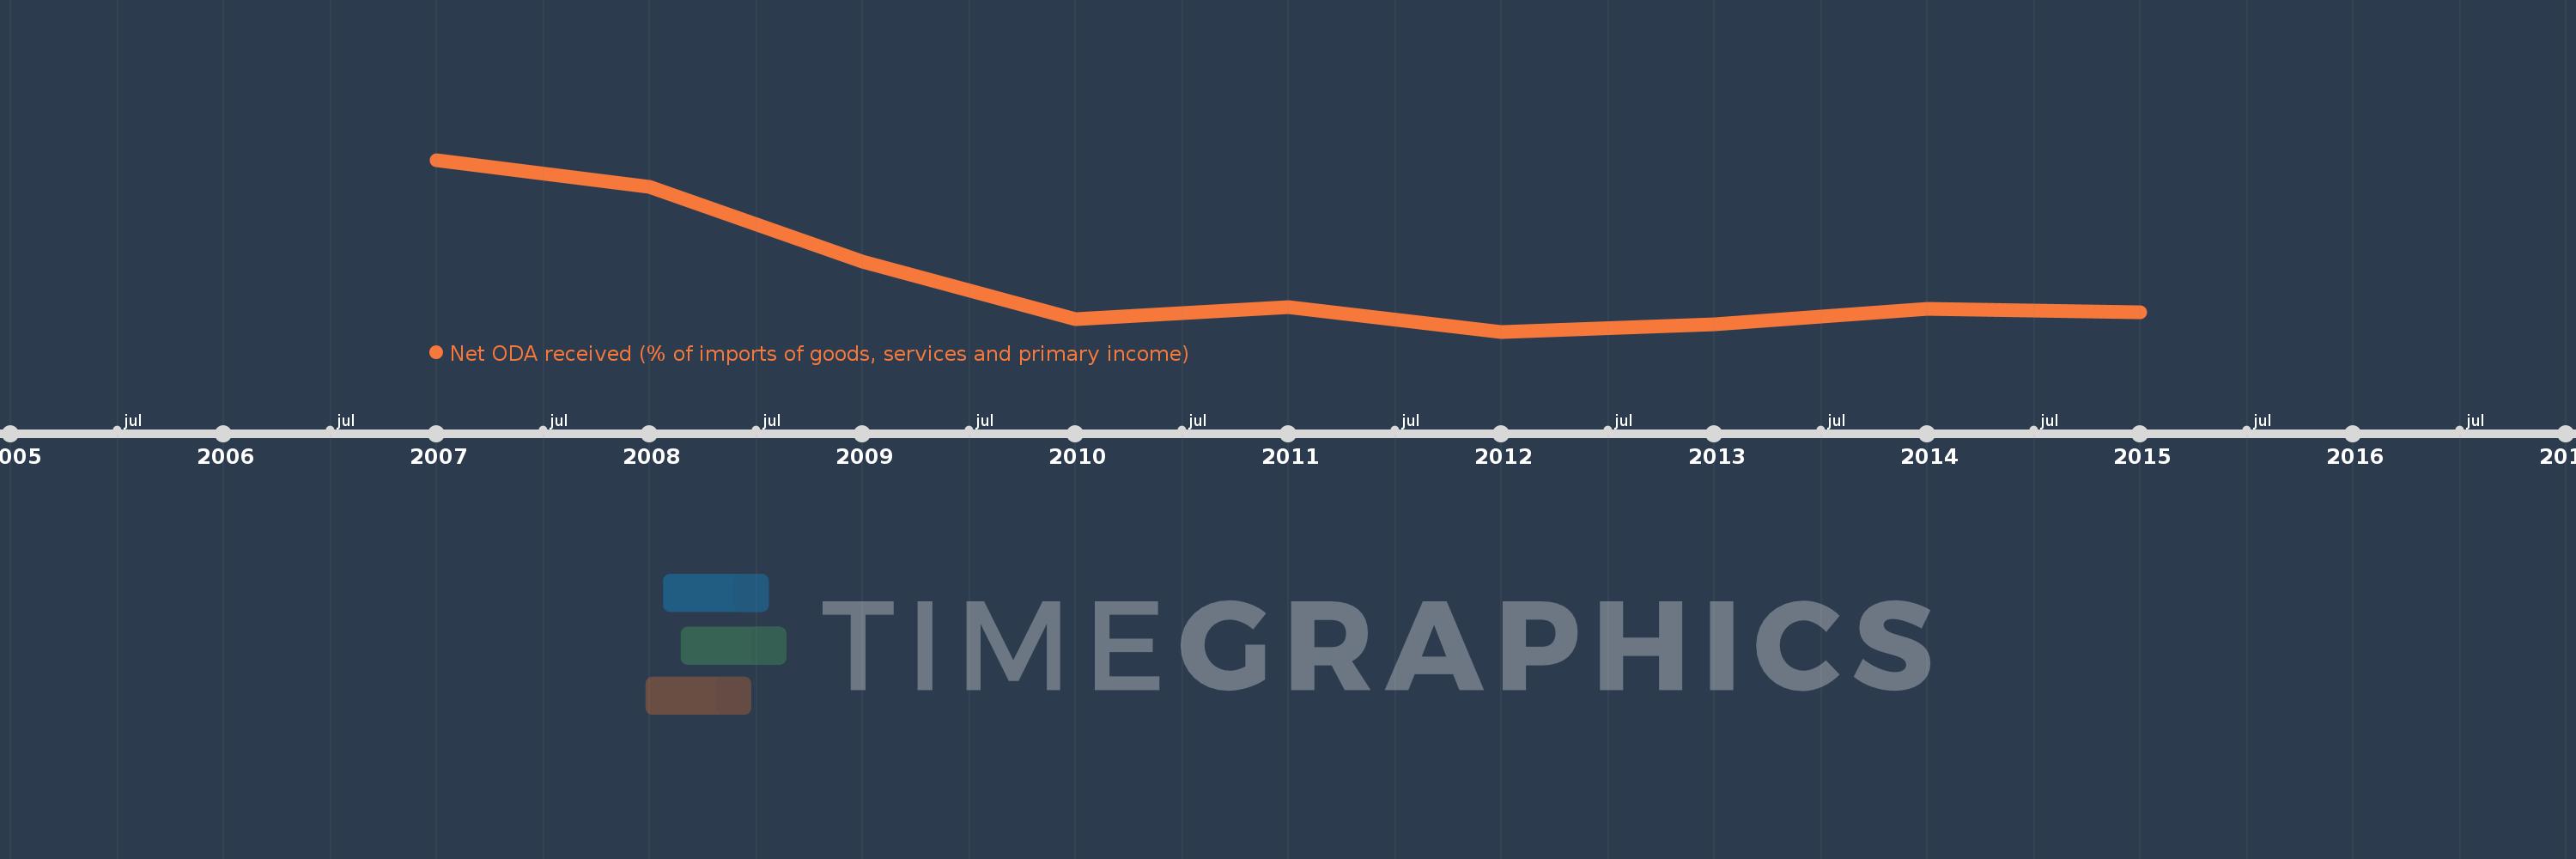
This timeline shows a graph from 2007 to 2015 of Timor-Leste. No data until 2006. Number of actual observations by date: 9.
Source name:
World Development Indicators
Source organization:
Development Assistance Committee of the Organisation for Economic Co-operation and Development, Geographical Distribution of Financial Flows to Developing Countries, Development Co-operation Report, and International Development Statistics database. Data are available online at: www.oecd.org/dac/stats/idsonline. World Bank imports of good and services estimates are used for the denominator.
Categories, topics:
Aid Effectiveness
Last updated:
apr 23, 2017
Indicators value changes by year
Meaning:
29.388
Minimum:
14.875
jan 1, 2012
Maximum:
62.397
jan 1, 2007
At the date of observation
Value
Absolute change
Change from the previous value
jan 1, 2007
62.397
+62.397
0.0%
jan 1, 2008
54.959
-7.438
-11.92%
jan 1, 2009
34.278
-20.681
-37.63%
jan 1, 2010
18.341
-15.937
-46.49%
jan 1, 2011
21.562
+3.22
17.56%
jan 1, 2012
14.875
-6.686
-31.01%
jan 1, 2013
16.79
+1.915
12.87%
jan 1, 2014
21.058
+4.267
25.41%
jan 1, 2015
20.228
-0.83
-3.94%
Ranking of countries by current statistics by years