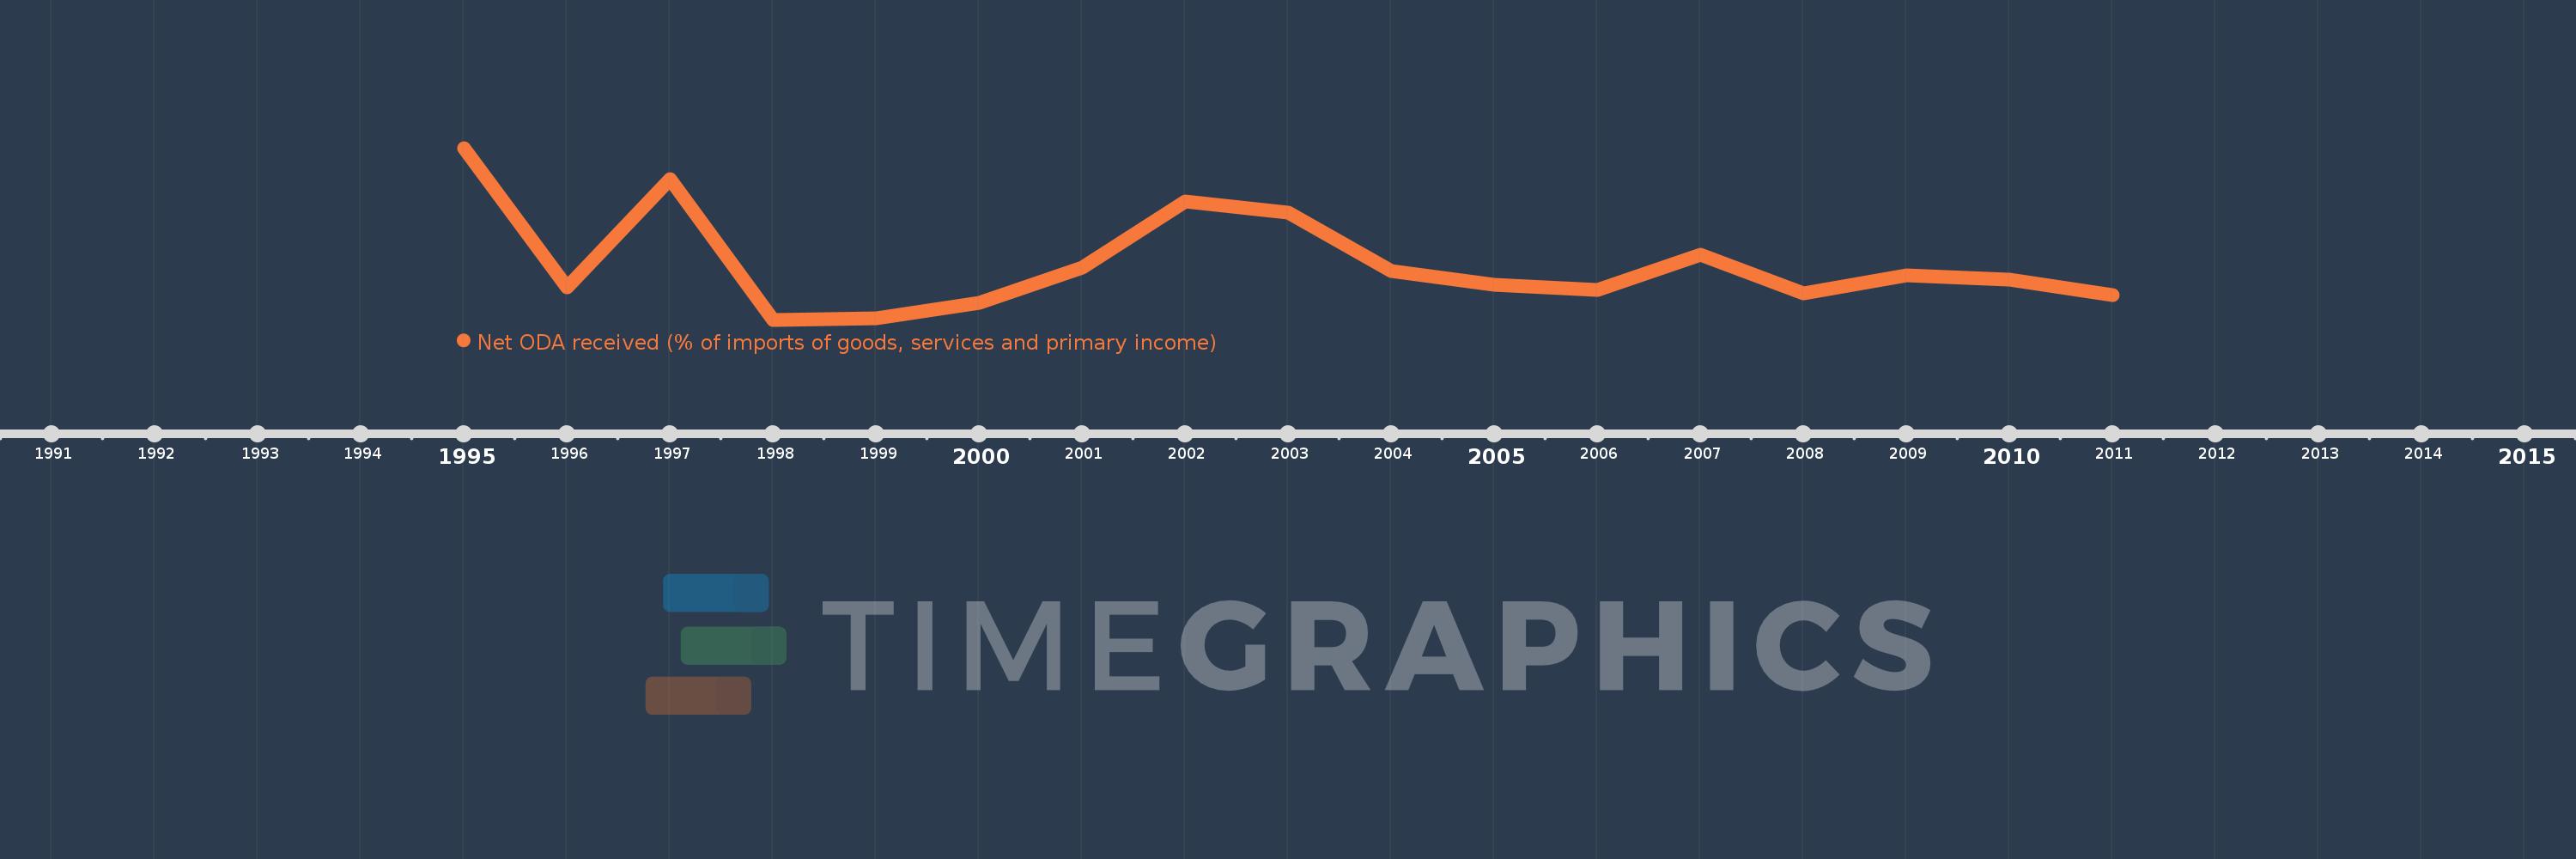
This timeline shows a graph from 1995 to 2011 of Croatia. No data until 1994. Number of actual observations by date: 17.
Source name:
World Development Indicators
Source organization:
Development Assistance Committee of the Organisation for Economic Co-operation and Development, Geographical Distribution of Financial Flows to Developing Countries, Development Co-operation Report, and International Development Statistics database. Data are available online at: www.oecd.org/dac/stats/idsonline. World Bank imports of good and services estimates are used for the denominator.
Categories, topics:
Aid Effectiveness
Last updated:
apr 23, 2017
Indicators value changes by year
Meaning:
0.727
Minimum:
0.343
jan 1, 1998
Maximum:
1.518
jan 1, 1995
At the date of observation
Value
Absolute change
Change from the previous value
jan 1, 1995
1.518
+1.518
0.0%
jan 1, 1996
0.567
-0.951
-62.66%
jan 1, 1997
1.304
+0.737
130.08%
jan 1, 1998
0.343
-0.961
-73.71%
jan 1, 1999
0.355
+0.012
3.46%
jan 1, 2000
0.461
+0.107
30.06%
jan 1, 2001
0.701
+0.24
51.96%
jan 1, 2002
1.151
+0.45
64.24%
jan 1, 2003
1.077
-0.075
-6.49%
jan 1, 2004
0.677
-0.4
-37.13%
jan 1, 2005
0.581
-0.095
-14.1%
jan 1, 2006
0.545
-0.036
-6.27%
jan 1, 2007
0.785
+0.24
44.12%
jan 1, 2008
0.523
-0.262
-33.38%
jan 1, 2009
0.648
+0.124
23.78%
jan 1, 2010
0.615
-0.033
-5.1%
jan 1, 2011
0.509
-0.106
-17.2%
Ranking of countries by current statistics by years