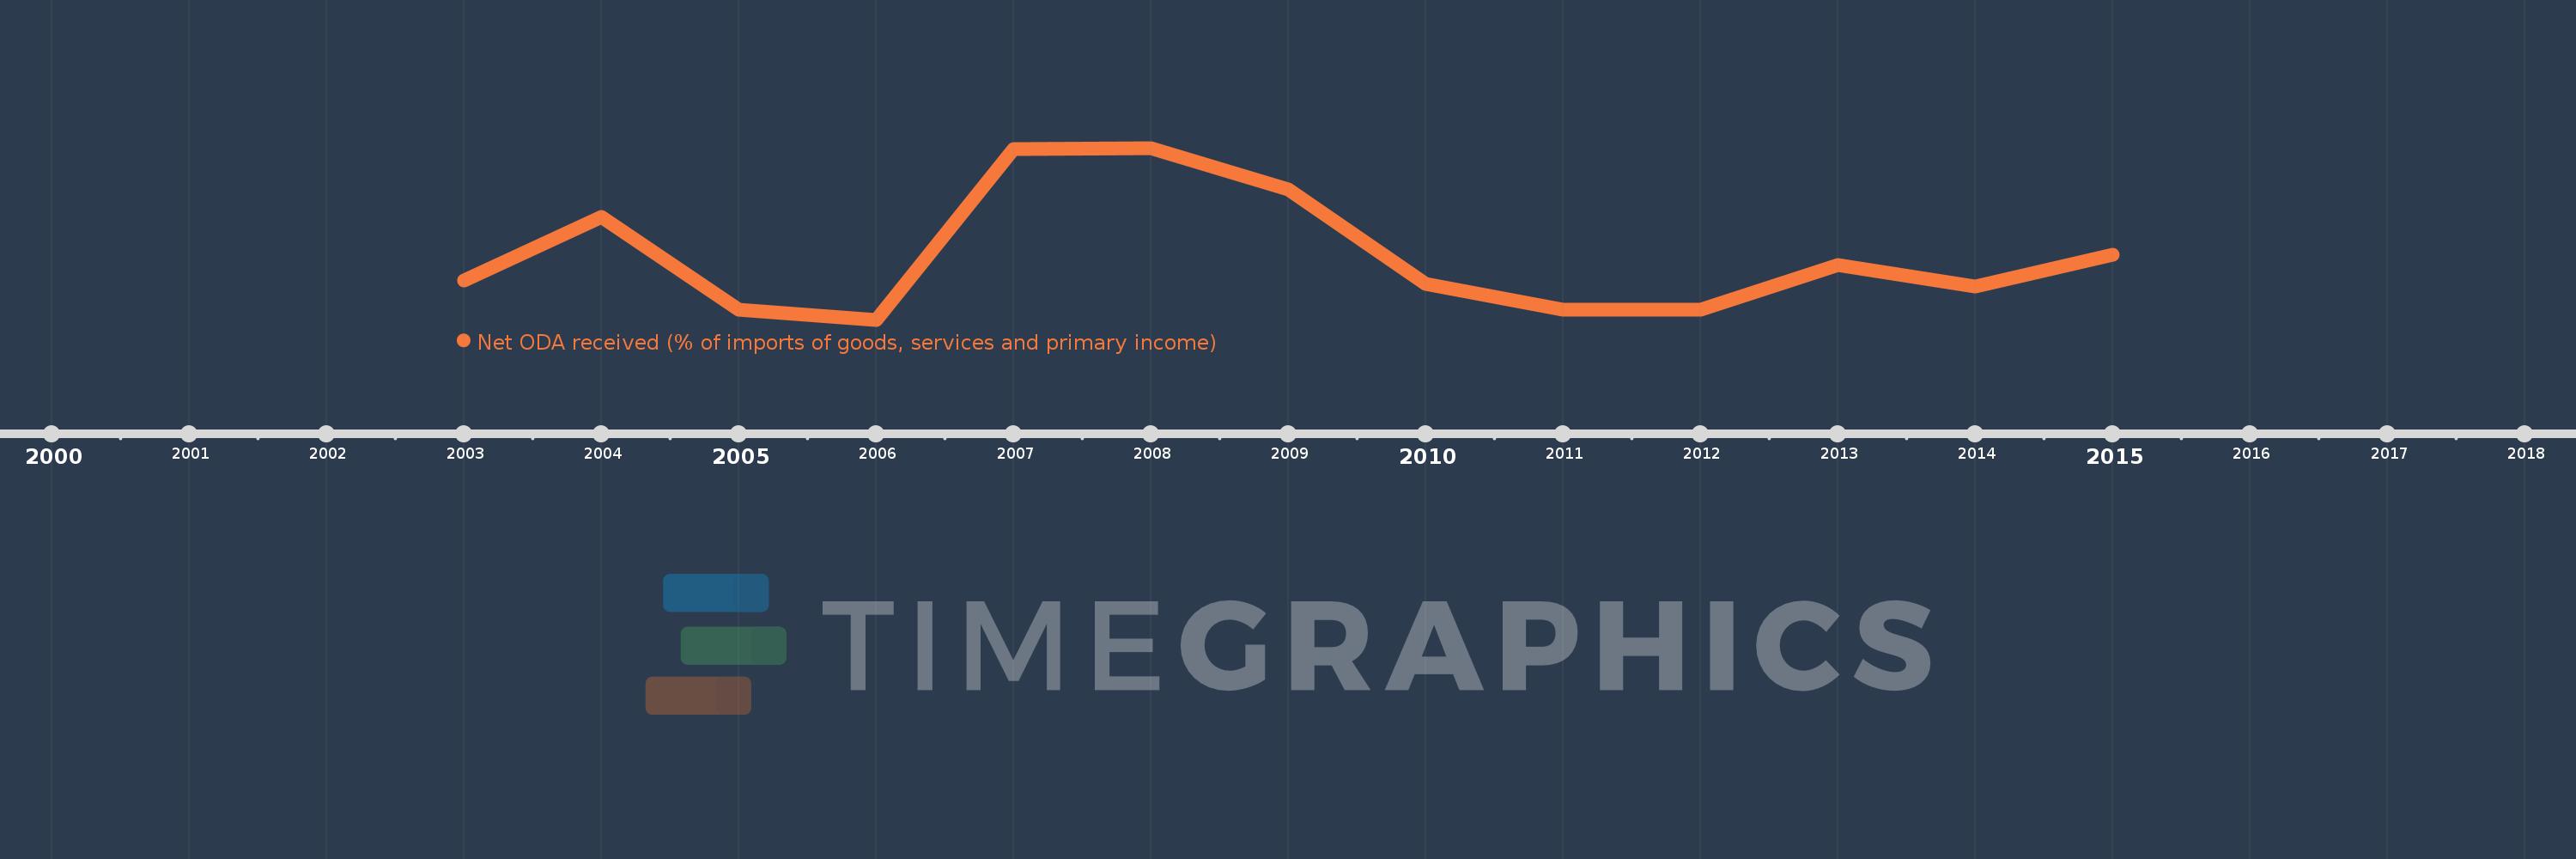
This timeline shows a graph from 2003 to 2015 of Lebanon. No data until 2002. Number of actual observations by date: 13.
Source name:
World Development Indicators
Source organization:
Development Assistance Committee of the Organisation for Economic Co-operation and Development, Geographical Distribution of Financial Flows to Developing Countries, Development Co-operation Report, and International Development Statistics database. Data are available online at: www.oecd.org/dac/stats/idsonline. World Bank imports of good and services estimates are used for the denominator.
Categories, topics:
Aid Effectiveness
Last updated:
apr 23, 2017
Indicators value changes by year
Meaning:
2.305
Minimum:
1.228
jan 1, 2006
Maximum:
4.11
jan 1, 2008
At the date of observation
Value
Absolute change
Change from the previous value
jan 1, 2003
1.892
+1.892
0.0%
jan 1, 2004
2.948
+1.056
55.8%
jan 1, 2005
1.398
-1.55
-52.58%
jan 1, 2006
1.228
-0.17
-12.13%
jan 1, 2007
4.093
+2.865
233.28%
jan 1, 2008
4.11
+0.017
0.42%
jan 1, 2009
3.421
-0.689
-16.77%
jan 1, 2010
1.83
-1.591
-46.5%
jan 1, 2011
1.391
-0.439
-23.99%
jan 1, 2012
1.398
+0.007
0.49%
jan 1, 2013
2.146
+0.748
53.5%
jan 1, 2014
1.786
-0.36
-16.78%
jan 1, 2015
2.322
+0.536
30.02%
Ranking of countries by current statistics by years